![]()
![]()
Feature
Messy Data, Real Science
Exploring harmful algal blooms with real-world data
The Science Teacher—April/May 2020 (Volume 87, Issue 8)
By AMY HAMMETT AND CHAD DORSEY

[A] major goal for science education should be to provide all students with the background to systematically investigate issues related to their personal and community priorities. They should be able to frame scientific questions pertinent to their interests, conduct investigations and seek out relevant scientific arguments and data, review and apply those arguments to the situation at hand, and communicate their scientific understanding and arguments to others. (National Research Council 2012, p. 278)
The modern world is practically defined by data. Students in classrooms today will enter an age in which fundamental interactions with the world—from consumer purchases to climate decisions, political and community actions, and even behavioral interactions—will intertwine with data analysis, representation, and understanding. How can we prepare today’s learners to become data-fluent? How do we do so while readying them for a future we can scarcely predict? Attempting to navigate toward answers while awash in data can challenge even the most seasoned data scientist. Nevertheless, a few tips and examples can serve as guideposts to creating experiences that equip students to thrive in a world of messy data.
Learning with data: An authentic, integrated undertaking
To learn with data, students need data to explore. This can be deceptive—data-rich experiences typically involve much more than a straightforward science lab. Solving real problems with data means identifying authentic questions that are meaningful to students and provide a foundation for deep inquiry. Such situations often lend themselves well to project-based learning approaches and are great opportunities for integration across subject areas. Perhaps most critically, they begin with a question of genuine interest to learners and genuine connection to the world at large. For purposes of illustration, we choose one such topic—the frequency of harmful algal blooms (HABs) in waters within and around the United States.
Anchoring phenomenon
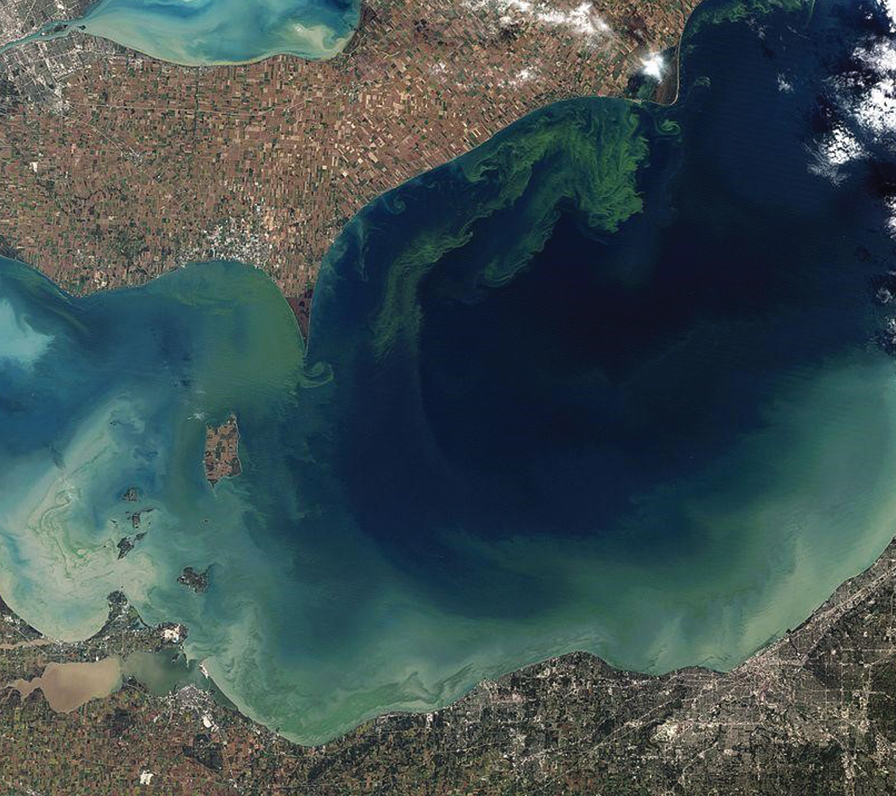
Algal blooms have increased significantly as temperatures have risen, and while some blooms may be simply visual nuisances, a surprising number pose dangers to humans and animal life (Figures 1 and 2). Such harmful algal blooms can modify food webs, alter the taste or quality of seafood or drinking water, or even produce cyanotoxins harmful to both water and land organisms (U.S. Geological Survey n.d.). These toxins have been implicated in human and animal illness and death in at least 43 states (USGS n.d.), and more than 80% of samples throughout all 50 U.S. states and Canada have tested positive for the most potent class of the toxins, called microcystins.
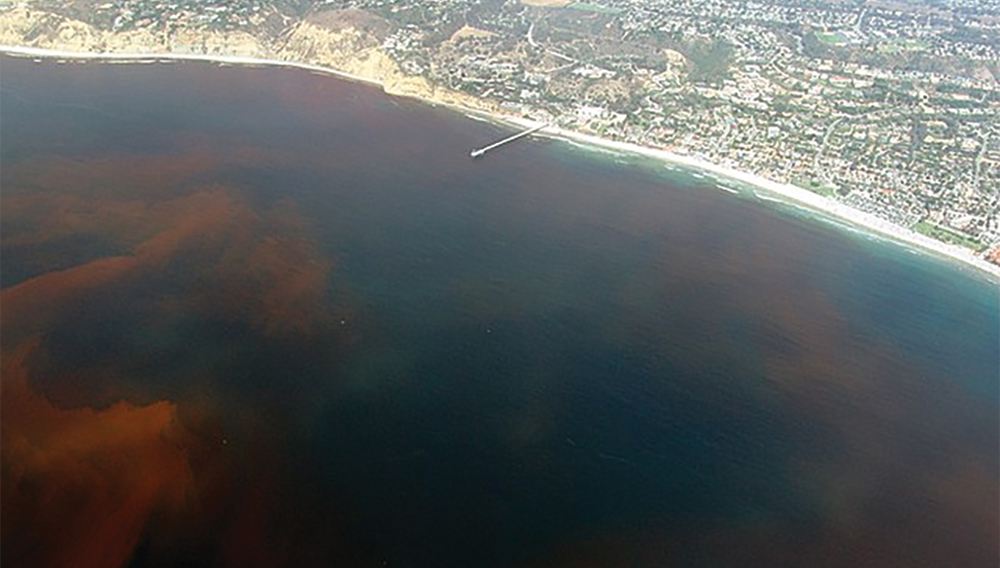
Red Tide caused by Dinoflagellates off the Scripps Institution of Oceanography Pier, La Jolla, California.
The topic of HABs is a good example of a subject primed for data-centered inquiry. Problems caused by HABs are highly relevant across the United States, and thus are of potential interest to students in many different locales. The causes of HABs are a complex blend of physical, chemical, biological, hydrological, and meteorological conditions (USGS n.d.). Moreover, despite the problem’s prevalence, many important unanswered scientific questions surround the functioning and occurrence of these toxins, making them an ideal launching pad for authentic investigation.
Most importantly for our purposes, research on HABs requires the use of data. These data can be produced by students through investigation of local lakes and ponds or even drinking water from the tap. Data sets from existing scientific surveys provide a second source for potential exploration. Additionally, data can be produced by and fed into statistical models, allowing students to generate and test ideas about the scientific mechanisms at play through mathematical modeling.
SAFETY
- DO conduct a safety assessment involving a hazards analysis, risk assessment, and appropriate safety actions. This includes researching and understanding the properties, chemical reactions, and dangers involved in all demonstrations and reviewing Safety Data Sheets (SDS) for ALL chemicals prior to using them. Plan to use correct handling and disposal procedures for all chemicals and biohazards used.
- DO secure sanitized personal protective equipment (i.e., eye protection, hand protection, apron, ear protection, and similar protective gear) for all presenters and participants when a demonstration involves the use of biological, chemical, or physical hazards. Personal protective equipment should be worn by participants and presenters during the setup of the activity, hands-on demonstration or experiment, and take-down of the activity.
- DO provide appropriate non-latex gloves and shields when working with biohazards.
- DO use a safety barrier when physical, biological, and chemical hazards exist.
Guidelines for data-rich investigations
Ready to launch into your first data-rich investigation? Some basic guidelines can help ensure that you and your students are headed in the right direction and make progress toward interesting and meaningful learning.
Make it personal
As students first begin investigating a topic, their relationship with the topic and its data are crucial considerations. Ideal topics support deep investigation and are relevant and motivating to students. By focusing on HABs in our example, we’ve chosen an anchoring phenomenon that inherently grabs students’ interest right where they live. (After all, how could scummy green algae growing in your drinking water not grab anyone’s interest?)
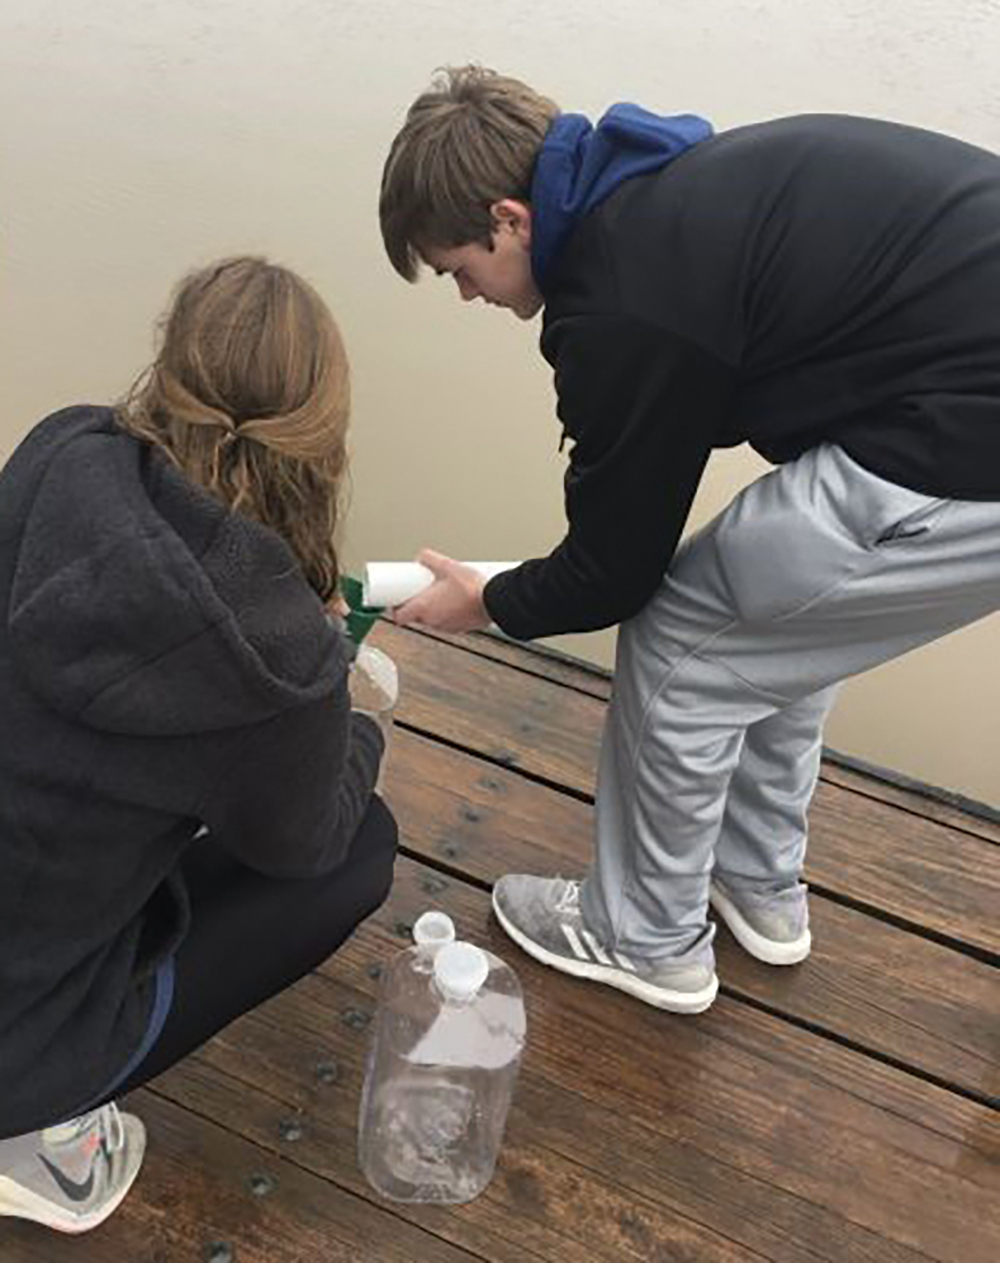
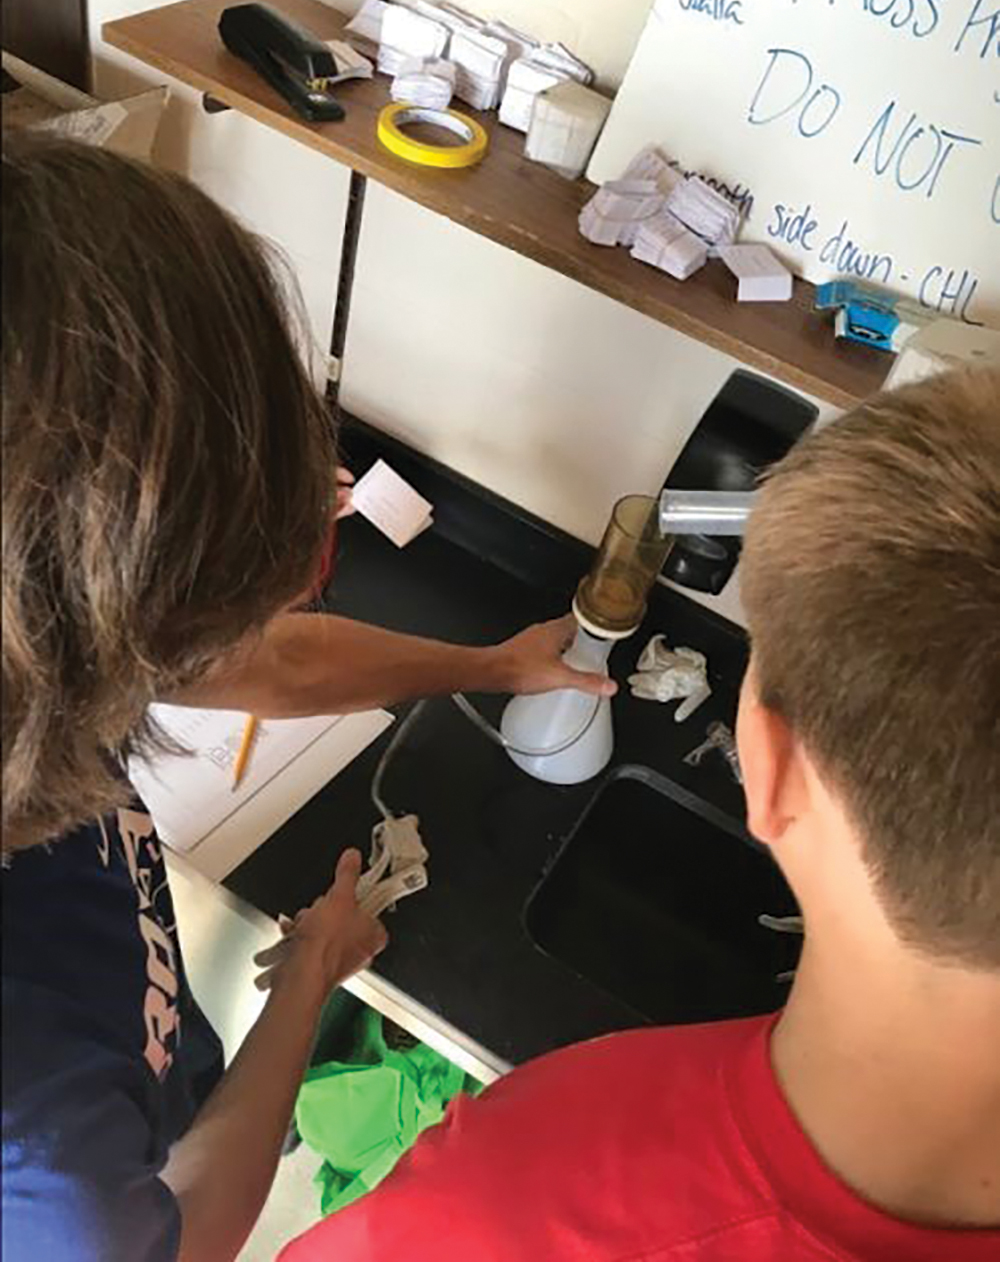
Additionally, with the HAB investigation, students begin by producing their own data from local sources. When beginning data investigations such as this one, students benefit enormously when they are able to leverage hands-on understanding of the processes used to produce the data. For example, our students collect freshwater from their local drinking water reservoir for water quality testing in their school lab (Figure 3). Back at the lab, they filter the water using a standard vacuum pump to quantify nitrogen compounds (NO3 and NH4); total suspended solids (TSS); chlorophyll; and phycocyanin, the pigment in blue-green cyanobacteria (Figure 4).
After measuring light penetration with a Secchi disk (Figure 5), students use sensors, microscopes, and chemical tests to measure turbidity, pH, dissolved oxygen, temperature, light, phosphorus compounds, nitrogen compounds, chlorides, and phytoplankton.
Student-modeling the interconnections of geosphere and hydrosphere to propose a solution to HABs.
Experiencing and investigating a data-related phenomenon firsthand in this way—before looking at larger, messier, and more abstract data—allows students to first examine self- collected data with the same data tools they will also use to explore larger data sets. (See Using CODAP to explore HAB data.)
Embrace a systems view
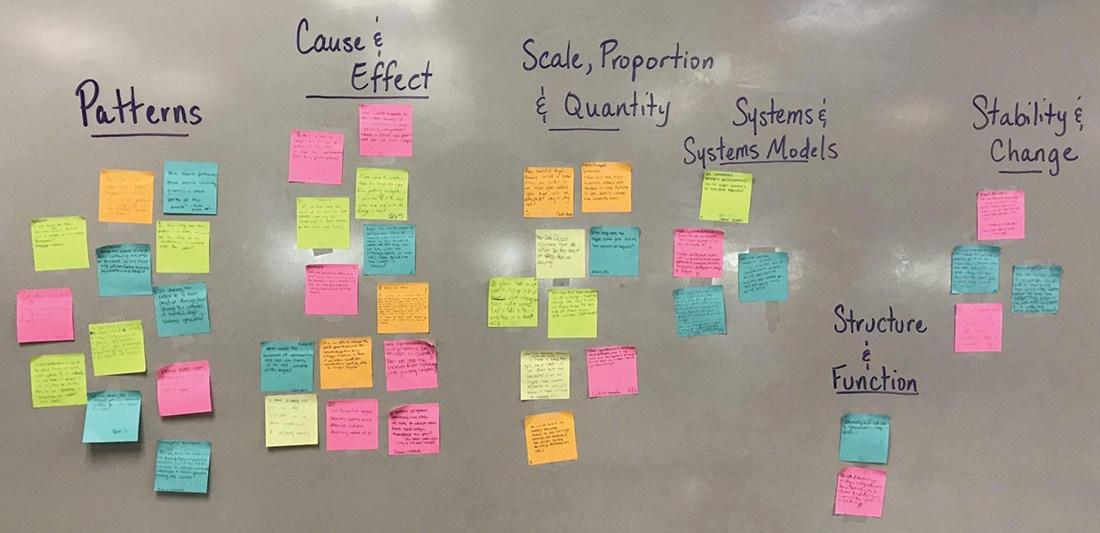
The absence of a preformed curriculum map in such investigations is both a liberating opportunity and an inherent pedagogical challenge. A systems lens can be a powerful tool to bring along for the journey. When moving into this new territory, invite students to first define the system under investigation—in particular, to specify its boundaries. Such boundaries supply scaffolds as students define their investigations and determine qualities of relevant data sets. Have students consider how the phenomenon is interconnected within and outside the defined system, like how the hydrosphere, geosphere, atmosphere, and biosphere interconnect in this student-defined system (Figure 6).
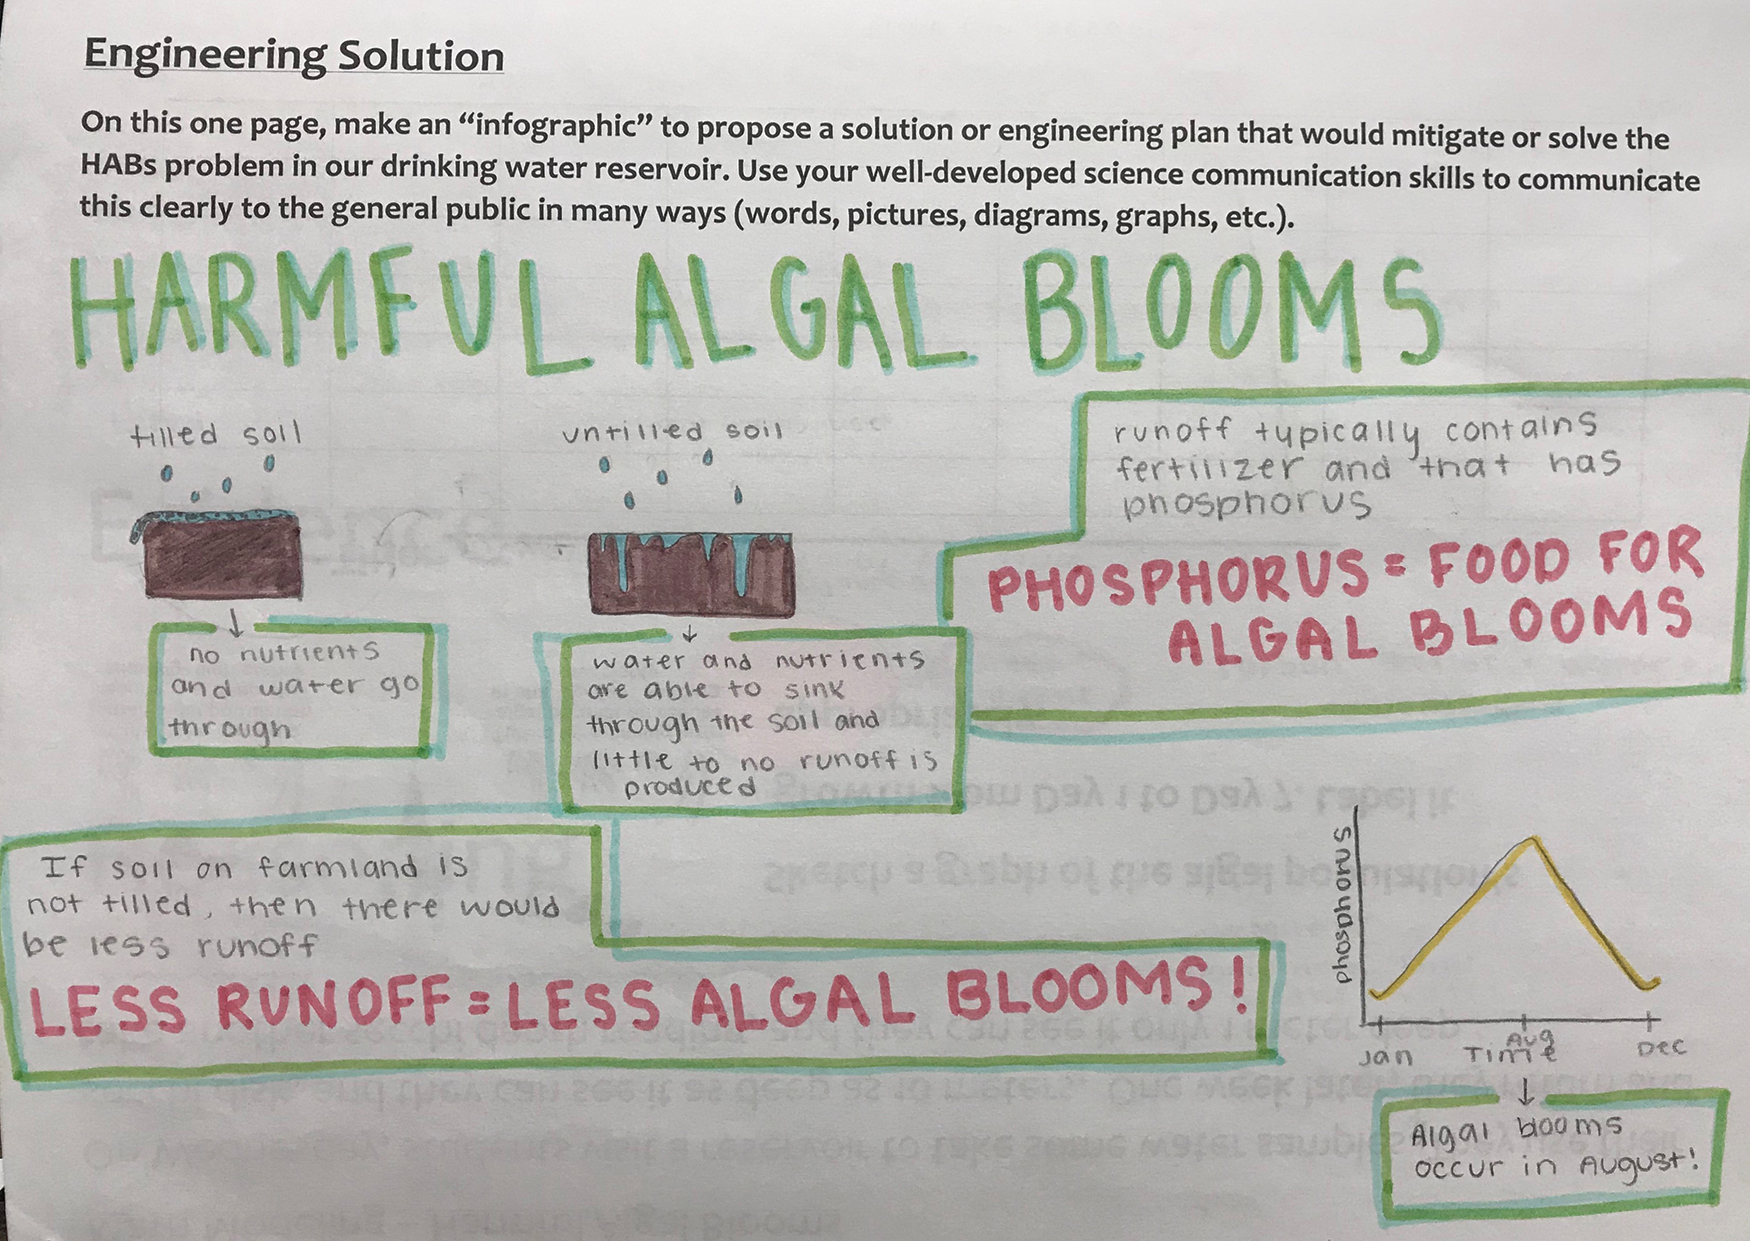
Then, with this systems view of the landscape, co-create a plan to investigate these systems and how they may or may not be changing. Both their driving questions (Figure 7) and their systems models outline a variety of approaches that your group of students might take to investigate and to generate claims and evidence about the phenomenon (Figure 8).
Consider the complexity
Building data-rich investigations also means considering other facets of data complexity. Melissa Kjelvik and Elizabeth Schultheis (2019) have proposed a variety of features to consider when engaging students with authentic scientific data explorations. These include considering
- the scope of the data (i.e., whether it is limited to only appropriate data or includes data students need to sort through and discriminate among);
- the selection of the data (whether the teacher, students, or both determine the variables to be monitored in producing data sets);
- the degree of curation of the data (whether the data set is summarized and ready for analysis or whether students must summarize, find, or combine data sets themselves); and
- the overall messiness of the data (whether data contain missing values, outliers, and variability).
In the HAB data, these various features of authentic data are front and center. When producing their own data, for example, students have the opportunity to determine variables to measure and make some choices about techniques they might use to measure them. This selection can be limited by providing more or less scaffolding or pre-determining measuring instruments, for example. Similarly, obtaining professional HAB data directly from the USGS website is a meaningful exercise in true-life data messiness; in succeeding, students must call upon relevant data fluency skills that go far beyond making graphs into computational tools, file types, and data structures. Making different choices, such as providing students with pre-curated data sets, avoids the need for this wrangling, but deprives students of the personal agency and the opportunity to build data science chops. The right choice is the one you need to determine as you weigh all the considerations.
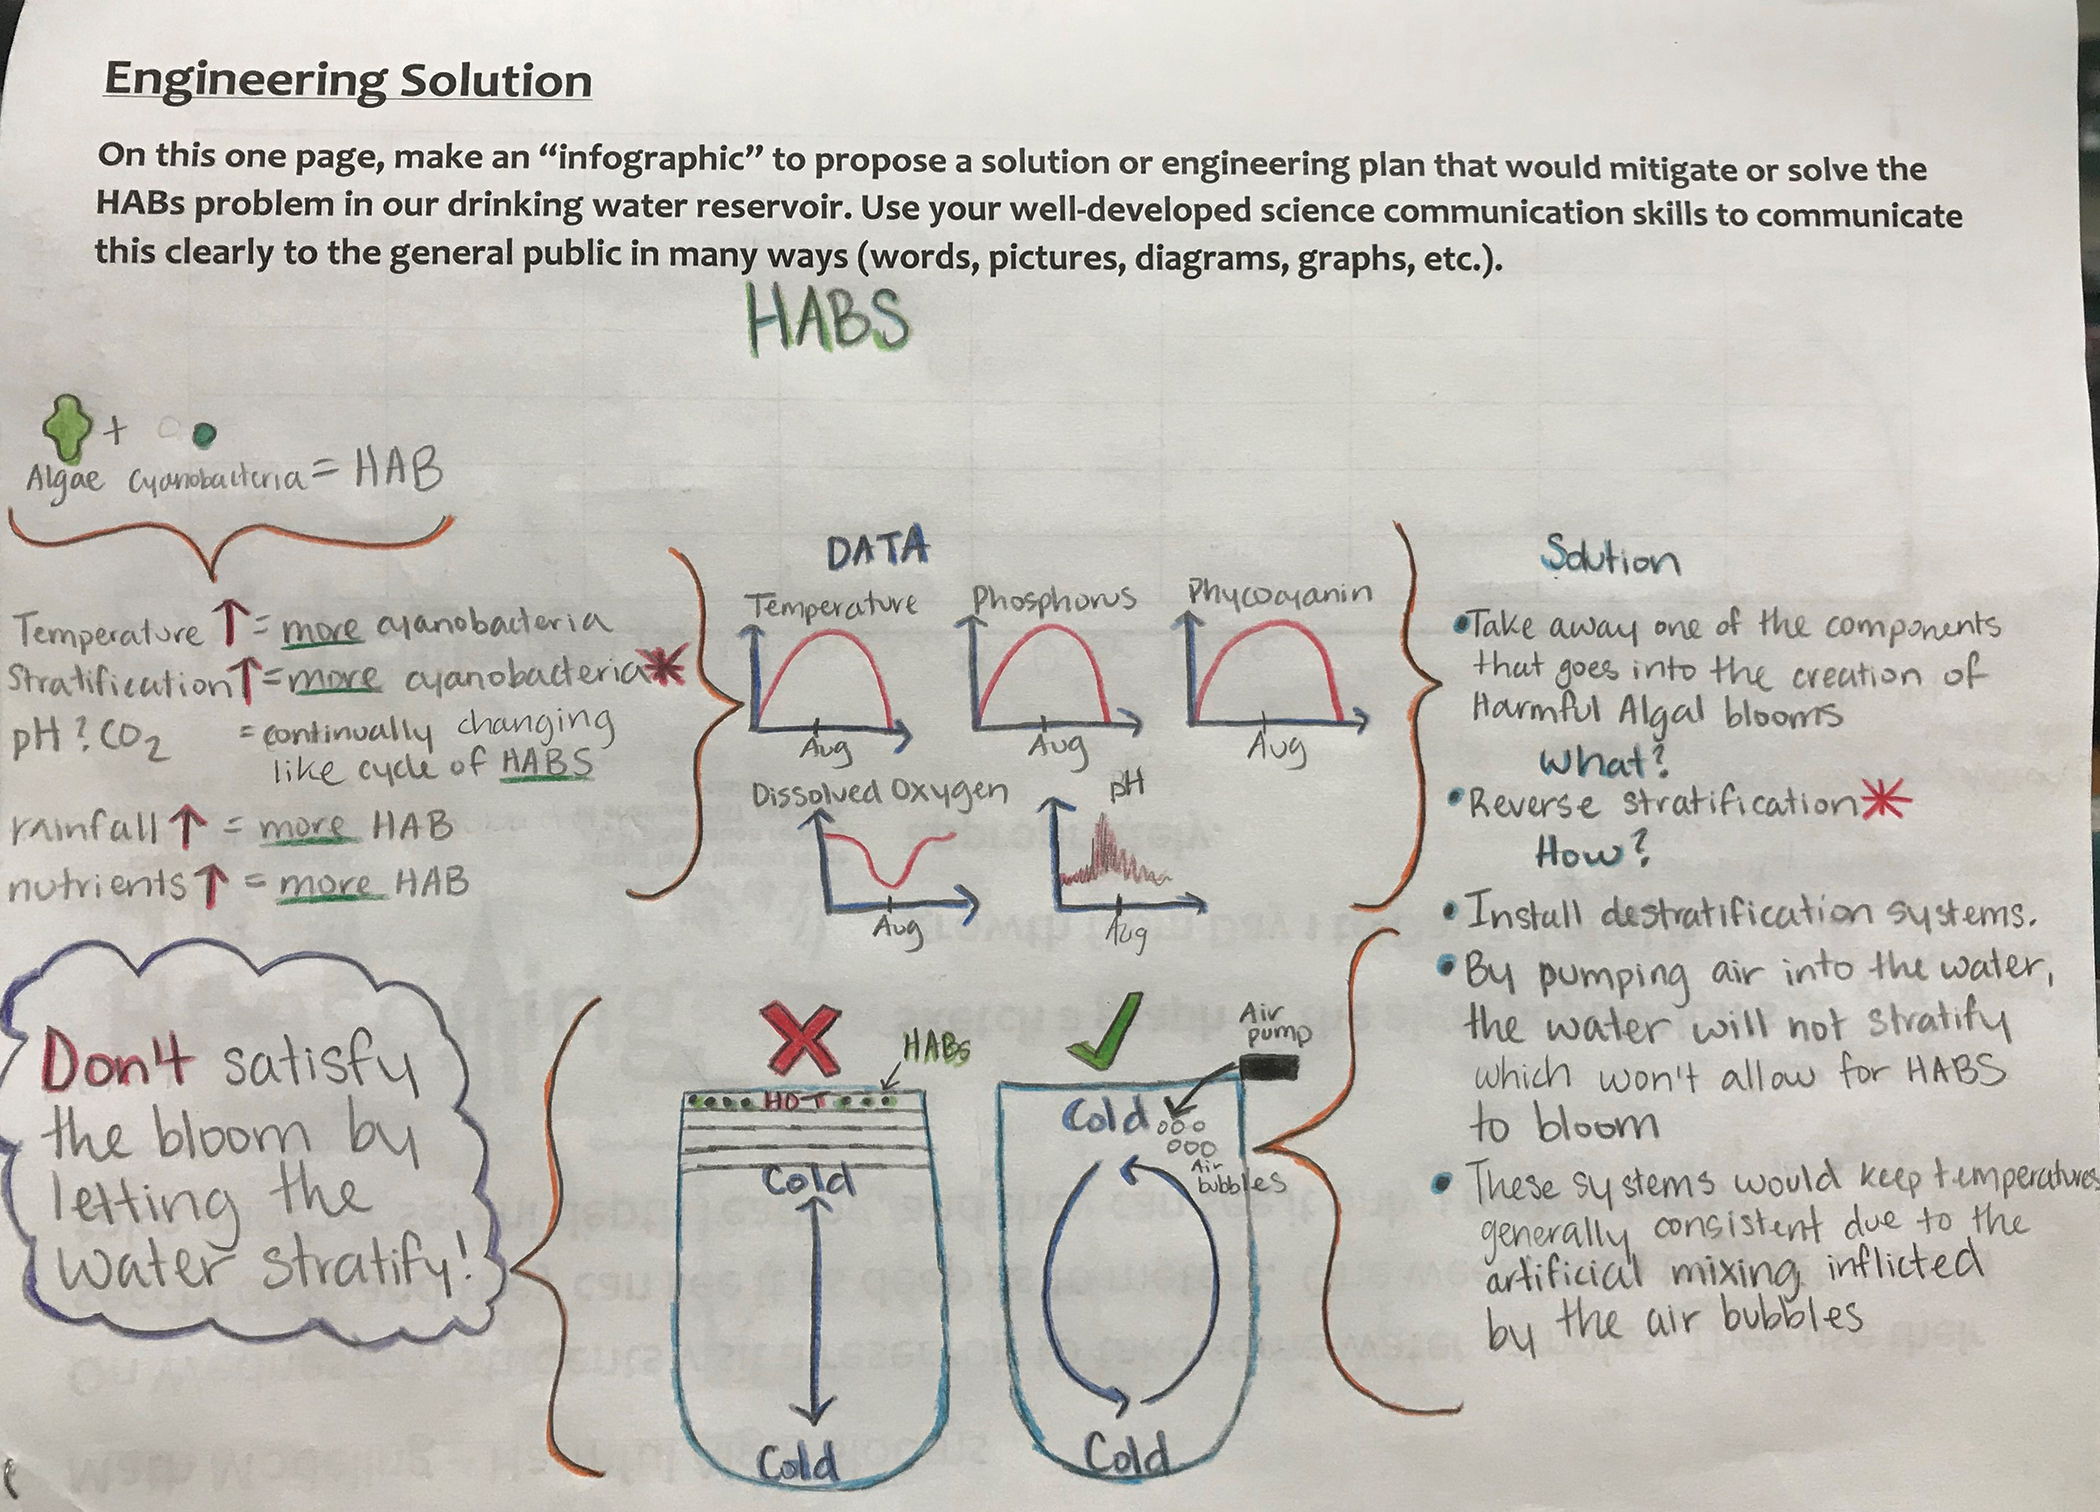
Data interpretation and proposed solution based on student-generated data visualizations.
Start small, then get bigger
When students begin to investigate data sets initially, they can benefit from beginning with a smaller data set at first, like this short timeframe of thermal stratification (Figure 10) from their student-constructed thermistor chain (Figure 11). Doing so allows them to appreciate the individual attributes of the data and to think about the relationships involved. With a smaller data set, students can begin to make sense of the data set’s context and explore its variation, both essential aspects of gaining familiarity with a data-focused scenario.
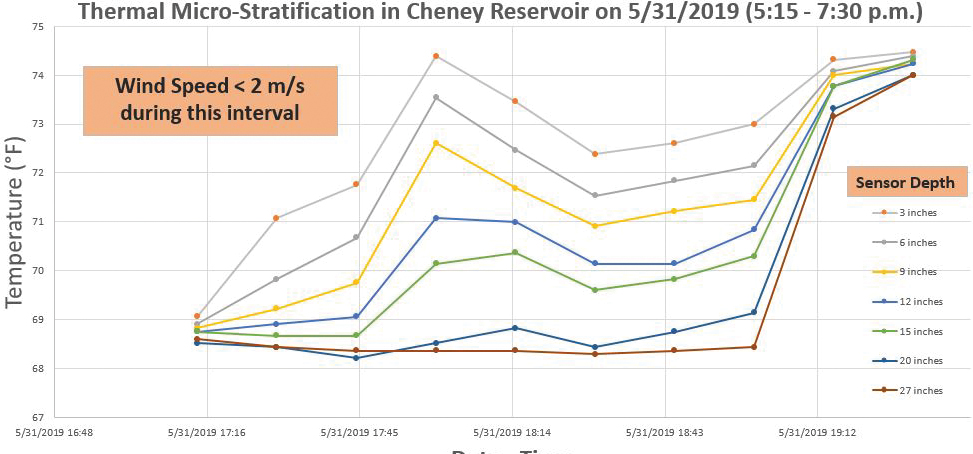
Graph of thermal micro-stratification over a short period of time within a larger time-series data set.
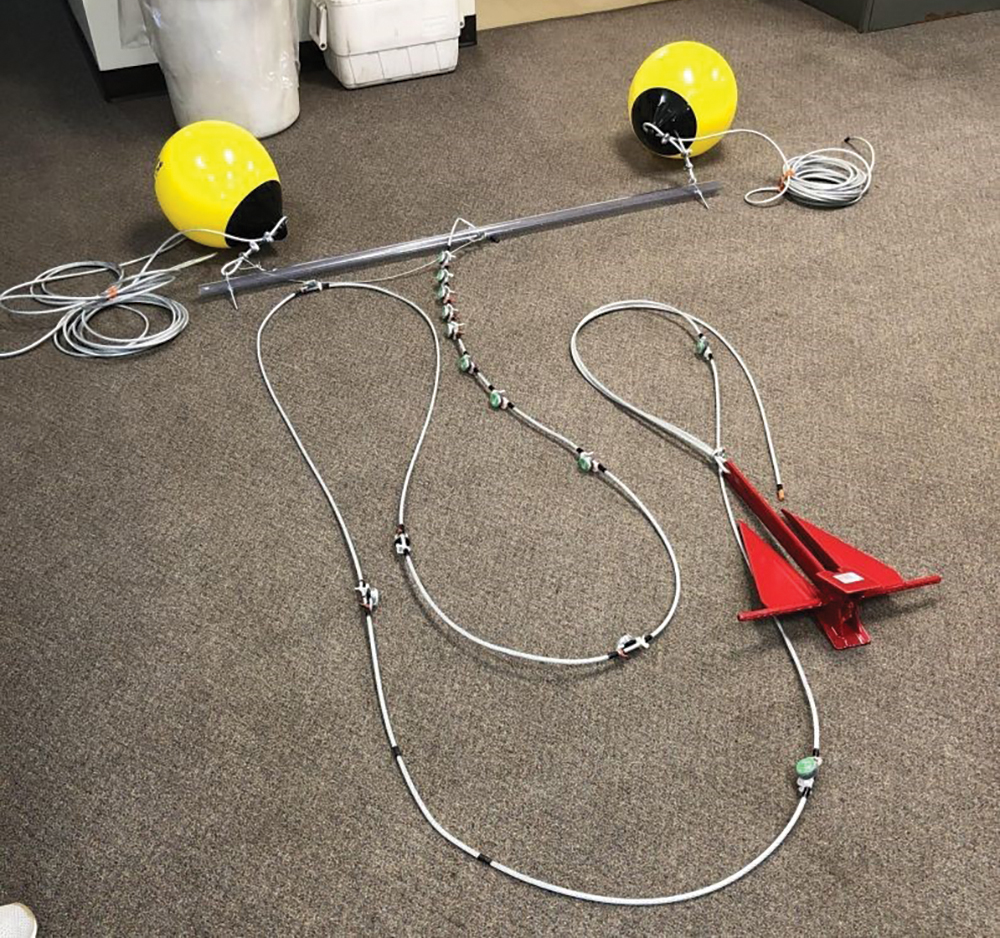
Student-constructed thermistor chain to collect light and temperature time-series data at various depths to the bottom of the local reservoir.
When investigating HAB data, students may start with only the data they have produced through a personal investigation. A few key prompts help them evaluate this new “data landscape.” What attributes are involved in their data set? What are their maximum and minimum values? What visualizations are appropriate to employ in examining the data set? Are there any typical or expected values? What is the “shape” of the data? Once students have gained an understanding of their personal data and can describe the representations they are generating and seeing, moving to a larger data set brings them into a new world of investigation (Figure 12). As they enter that world, their previous experience acts as a map for redoubled sense-making.
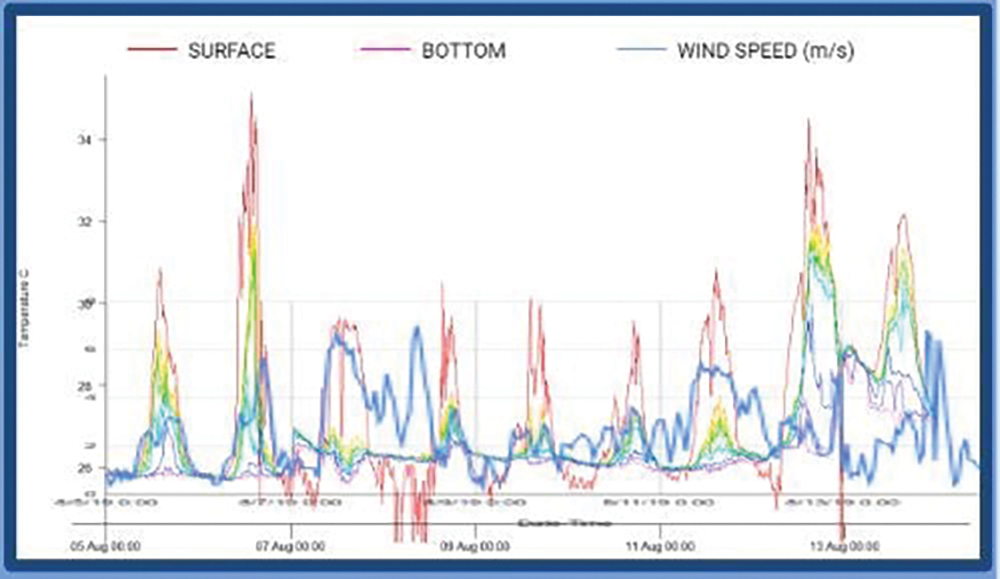
A map of heat layers students generated in rLakeAnalyzer overlaid with wind speeds to visualize correlation with lake surface thermal stratifications, which favor algal blooms.
Open-ended data investigation can allow students to unlock many intriguing stories hidden within data sets. However, students’ ability to make discoveries in data depends critically on the tools they have available. While it is possible to use spreadsheets or online chart-making software to visualize data, there is a better way. Using dedicated data tools to explore and visualize data can transform a simple data set from a cryptic mass of numbers to a treasure trove of realization and insight. One such tool is the Common Online Data Analysis Platform (CODAP—https://codap.concord.org), a free, open-source online tool designed for learning with and about data.
Bringing data into CODAP is as simple as importing it—or even dragging and dropping it—into a new CODAP document. Any data set saved as a comma-separated-value (CSV) file will do. The data table will be instantly displayed within CODAP. Students can make a graph by pressing a single button, with one interesting twist: to graph one or more data attributes, students drag the title from the table onto the axis of the graph where they wish to see it displayed. This simple feature makes it deliberately easy to create multiple graphs quickly and explore potential relationships among data attributes. Viewing geographically related data within CODAP is just as simple; any data with labeled latitude and longitude columns display automatically on a map.
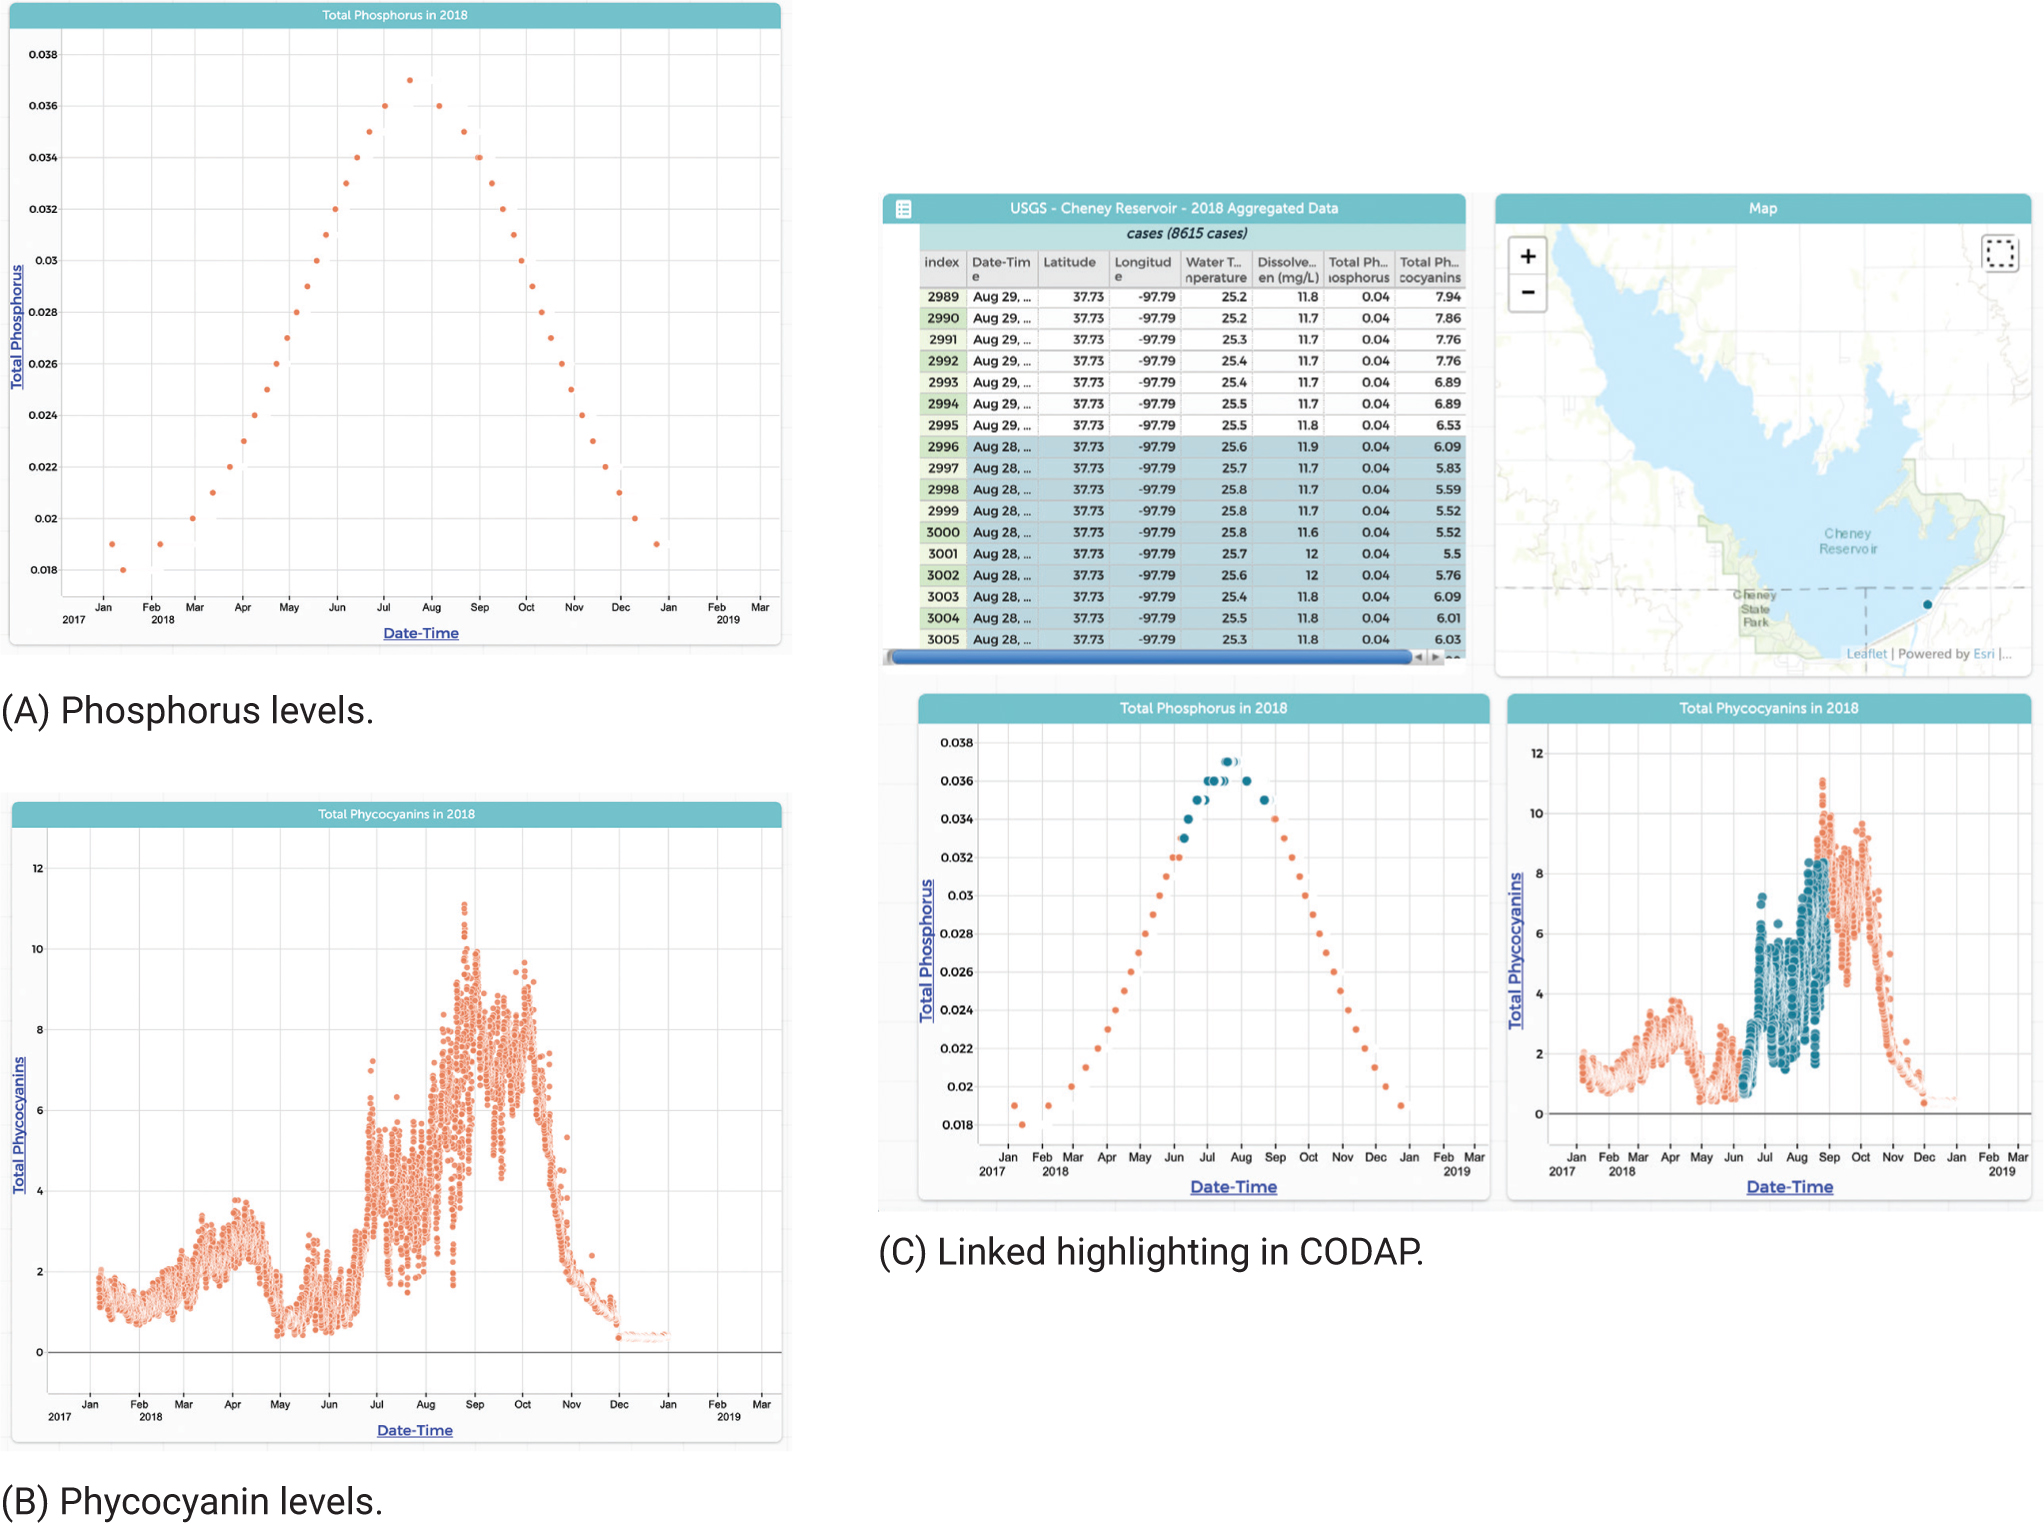
Lastly, CODAP makes identifying connections within data seamless. Selecting an area of a graph or table highlights the same data points in all other representations. The graphs below show examples using USGS water quality data taken at Cheney Reservoir in Kansas in 2018. The student-created graphs of phosphorus (A) and of phycocyanins, the pigment in cyanobacteria (B). Curious about high phosphorus levels, she highlighted the peak of the first graph, and she saw the connection to algal blooms jump out in the other graph and in the data table (C).
CODAP is freely available for anyone to use, and contains many more features for data exploration and statistical analysis.
Authentic science: Let the data lead the way
Once students are familiar with their data, true inquiry can begin. With robust data related to a core anchoring phenomenon at the helm, the full realm of science and engineering practices lie open for the journey.
That’s the joy—and often the problem, too. As a teacher, helping lead students through this new land can sometimes feel uncertain. If there’s anything to know about the world of data science, it’s that big, messy data sets harbor as many answers as there are question-askers. With an interesting data set, the chances of not finding something worth exploring are extremely slim. Of course, that’s the peril as well—taking stock of students’ status and helping guide them on their journey are both important, but not as important as giving your learners some latitude to find and investigate their own questions and the freedom to follow where the data leads.
Recall the purpose of the endeavor. As teachers of science, our role is not to be the leaders, but the guides. And, as we prepare students for an unknown, data-filled future, our role is to do whatever it takes to ensure that they are so bold and so tenacious that they are empowered to seek answers along trails they blaze themselves. We do well to recall the words of Jean Piaget when he professed that the principal goal of education is to “create men and women who are capable of doing new things, [and] not simply repeating what other generations have done” (1964). Guiding students through data-rich investigations is the first step in building these capabilities for years to come.
Biology Climate Change Computer Science Labs Life Science High School