![]()
![]()
start with phenomena
Learning the Temperature Dependency of Matter by Making Ice Cream
Science and Children—September/October 2021 (Volume 59, Issue 1)
By Patrick Brown
Learning science by doing science is increasingly expected in our elementary classrooms. To incorporate more active learning, this simple investigation in temperature and phase changes engages students in science. By integrating content with practices through the purposeful phases of the 5E instructional sequence, students develop long lasting conceptual understanding and transfer their understanding to other similar circumstances (Bybee 2015).
The lesson described here uses coffee creamer containers as the phenomenon for fifth-grade students learning about changes of state from liquid to solid and conservation of matter. The unique activities in this 5E lesson combines all three dimensions of the Next Generation Science Standards (NGSS)—science and engineering practices, crosscutting concepts, and disciplinary core ideas. Students begin to explore the concepts in the performance expectation (PE) to “measure and graph quantities to provide evidence that regardless of the type of change that occurs when heating, cooling, or mixing substances, the total weight of matter is conserved” (NGSS Lead States 2013; 5-PS1-2). The activities used in this lesson help students overcome widespread misconceptions about solids, liquids, and gases and conservation of mass during a change of state (Driver et al. 2000). What follows is 5E lesson that allowed fifth-grade students to test ideas in new and different circumstances.
Engagement
The purpose of the Engage phase was to: (1) situate learning around an investigable phenomenon, (2) identify students’ incoming ideas, and (3) identify the learning goals for the lesson. The phenomenon that was anchoring the investigation was embedded in the pre-assessment probe of students’ prior knowledge and experiences about why they put salt on the roads before a winter snowstorm (see Supplemental Materials) (Teachers should show a picture of salty roads in the winter to provide visual support for the formative assessment probe.).
Once students had the formative assessment probe, I wanted students to brainstorm ideas on their own and not feel threatened to share ideas. I emphasized this was not a graded task but rather an essential step to building understanding. Once students had committed to ideas by writing them down, I had them share with a shoulder partner. Students had very similar ideas, as Aiden wrote, “so the ice or snow mealts (meaning melts)” and “so it is not slic (meaning slick)” (see Figure 1).
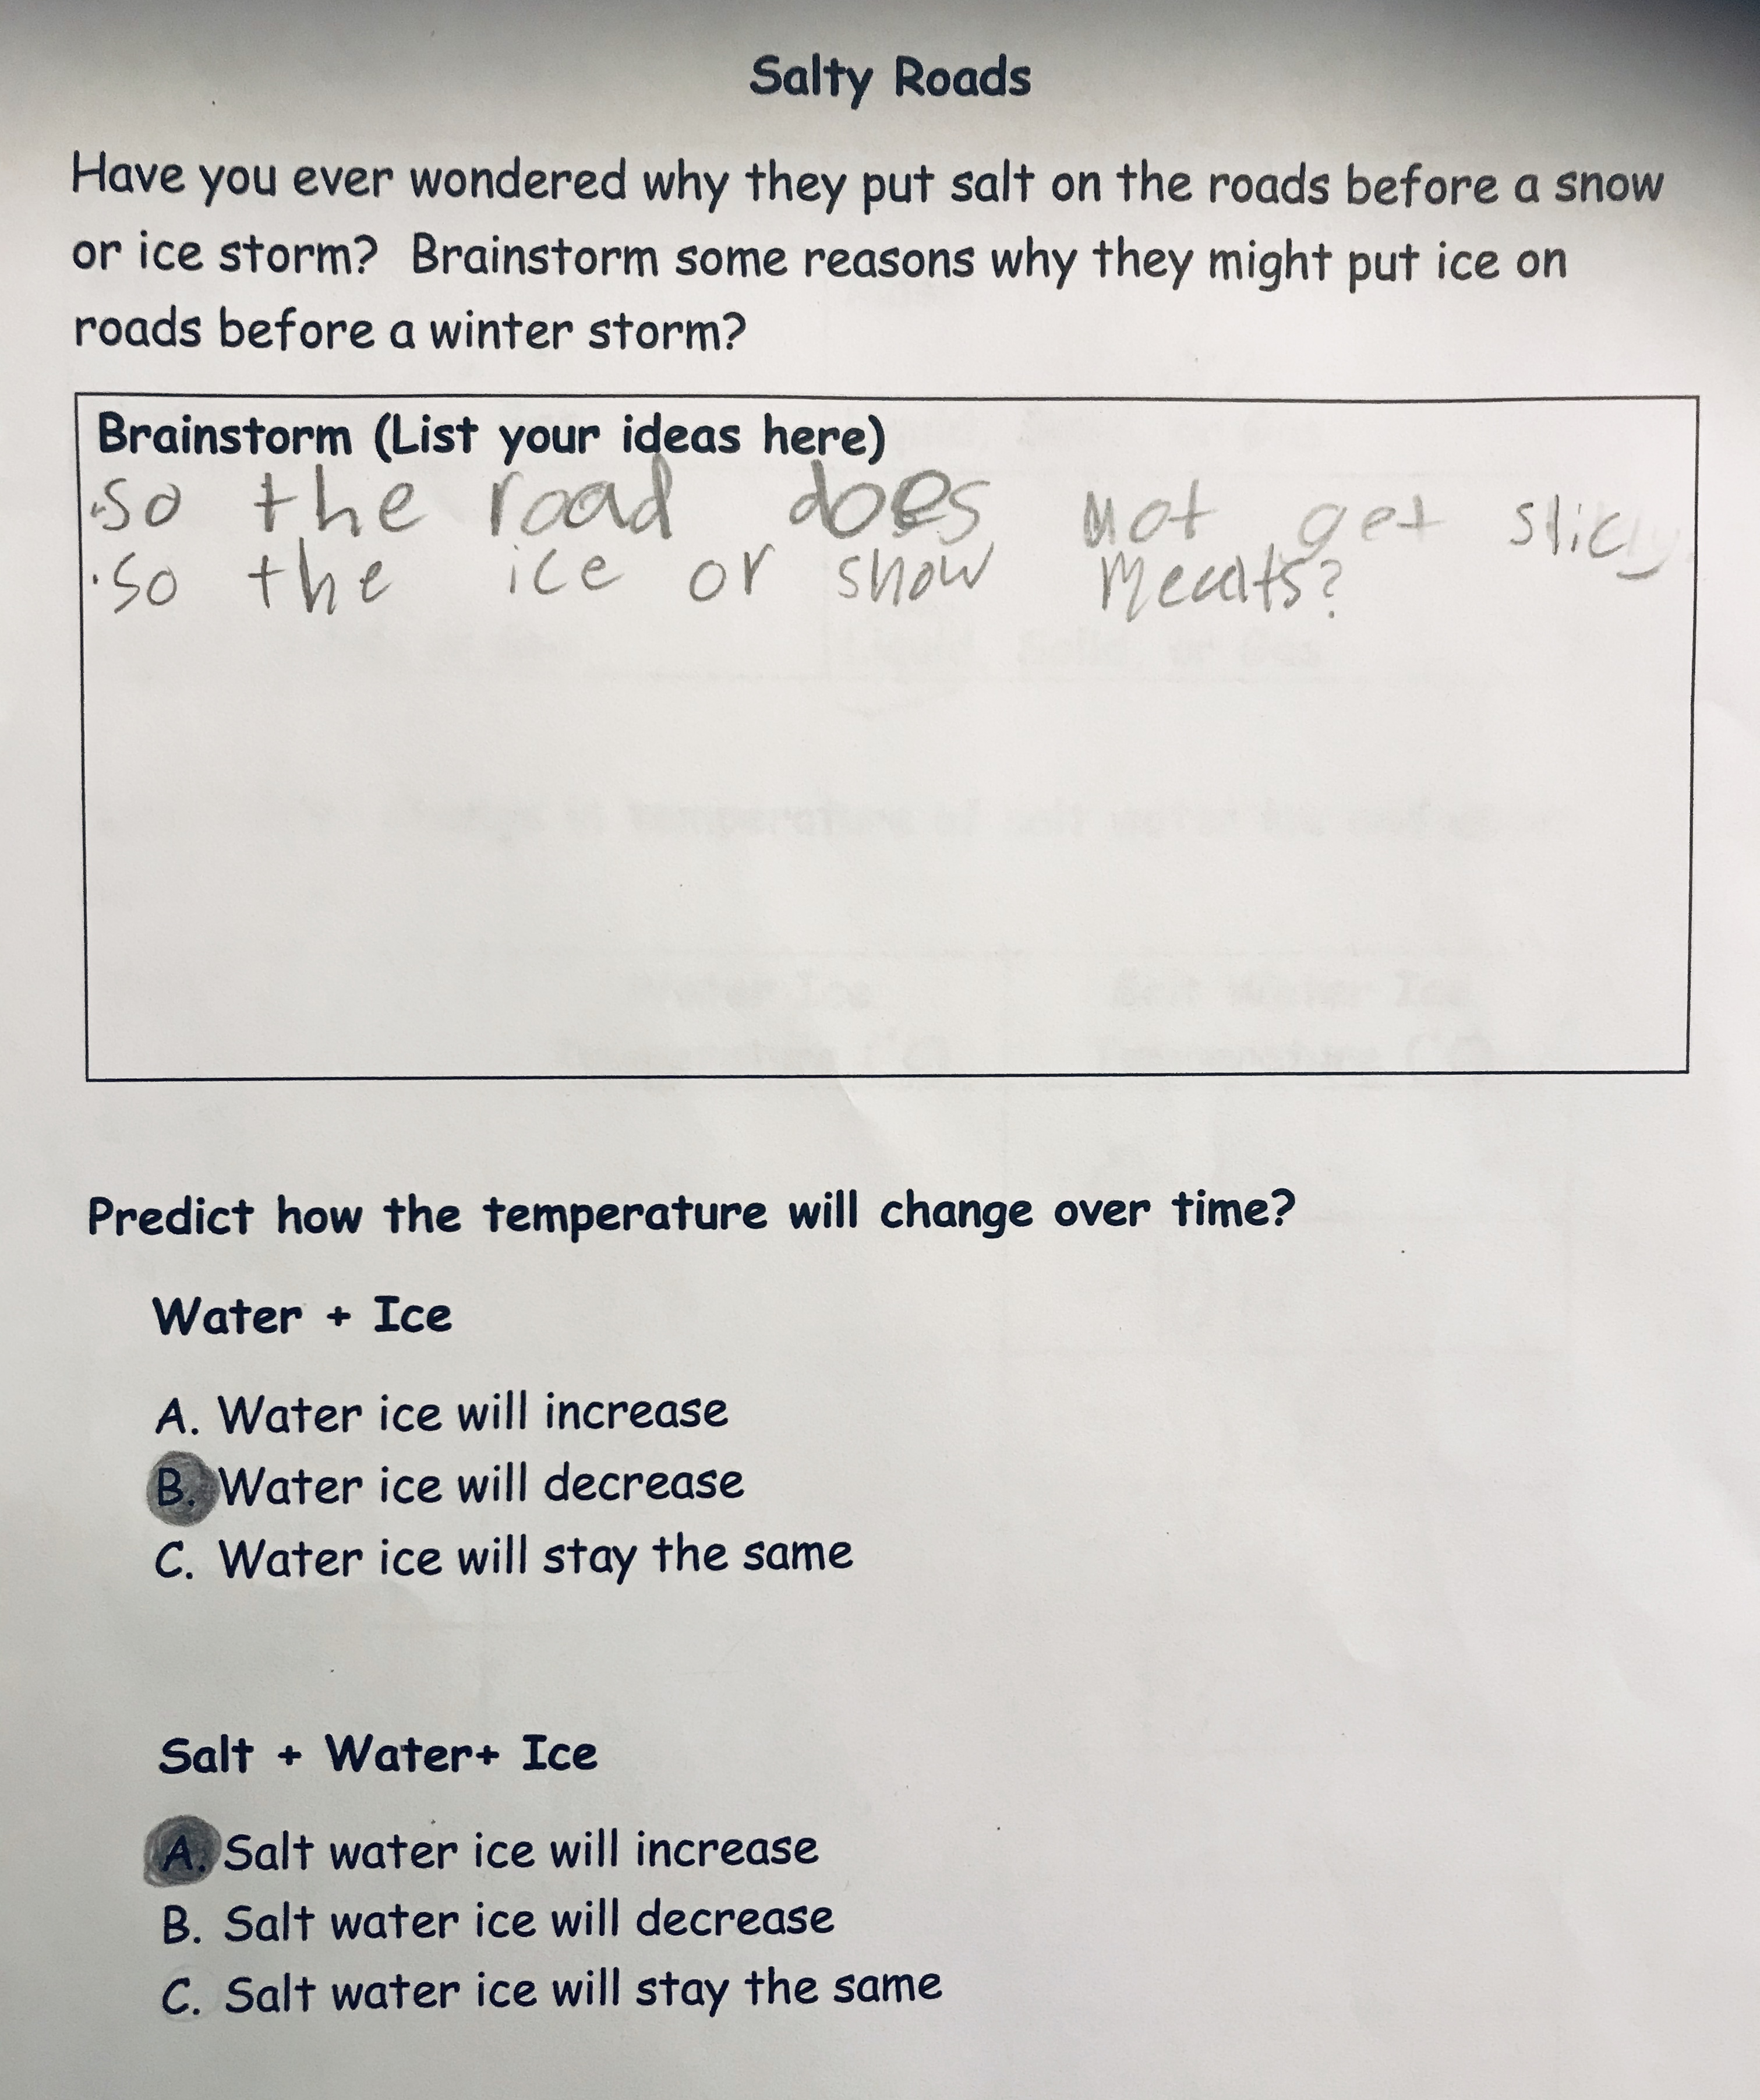
I followed the brainstorming activity with two selected-response items. The first asked students to predict how adding ice to water will change the temperature of water over time. The second asked students how adding ice to a container of salt water would influence the temperature over time. Nearly all of the students thought adding ice to water would cool the temperature and conversely, adding ice to the salt water would increase the temperature (see Figure 1). A tiny percentage of students thought the opposite.
I asked students to provide reasoning for their thinking. Noel explained, “We put salt on snow to make it warmer,” and Quinn chimed in saying, “adding salt to ice water will make it hotter.” With students’ ideas in hand, I identified for students the goal of the lesson was for them to be able to make an evidence-based claims about the relationships between temperature, state of matter, and amount of material (mass). This classroom goal meant students would need to learn new mathematical and computational thinking skills such as using thermometers to take temperature and measuring mass using electronic balances.
Exploration (8 Minutes
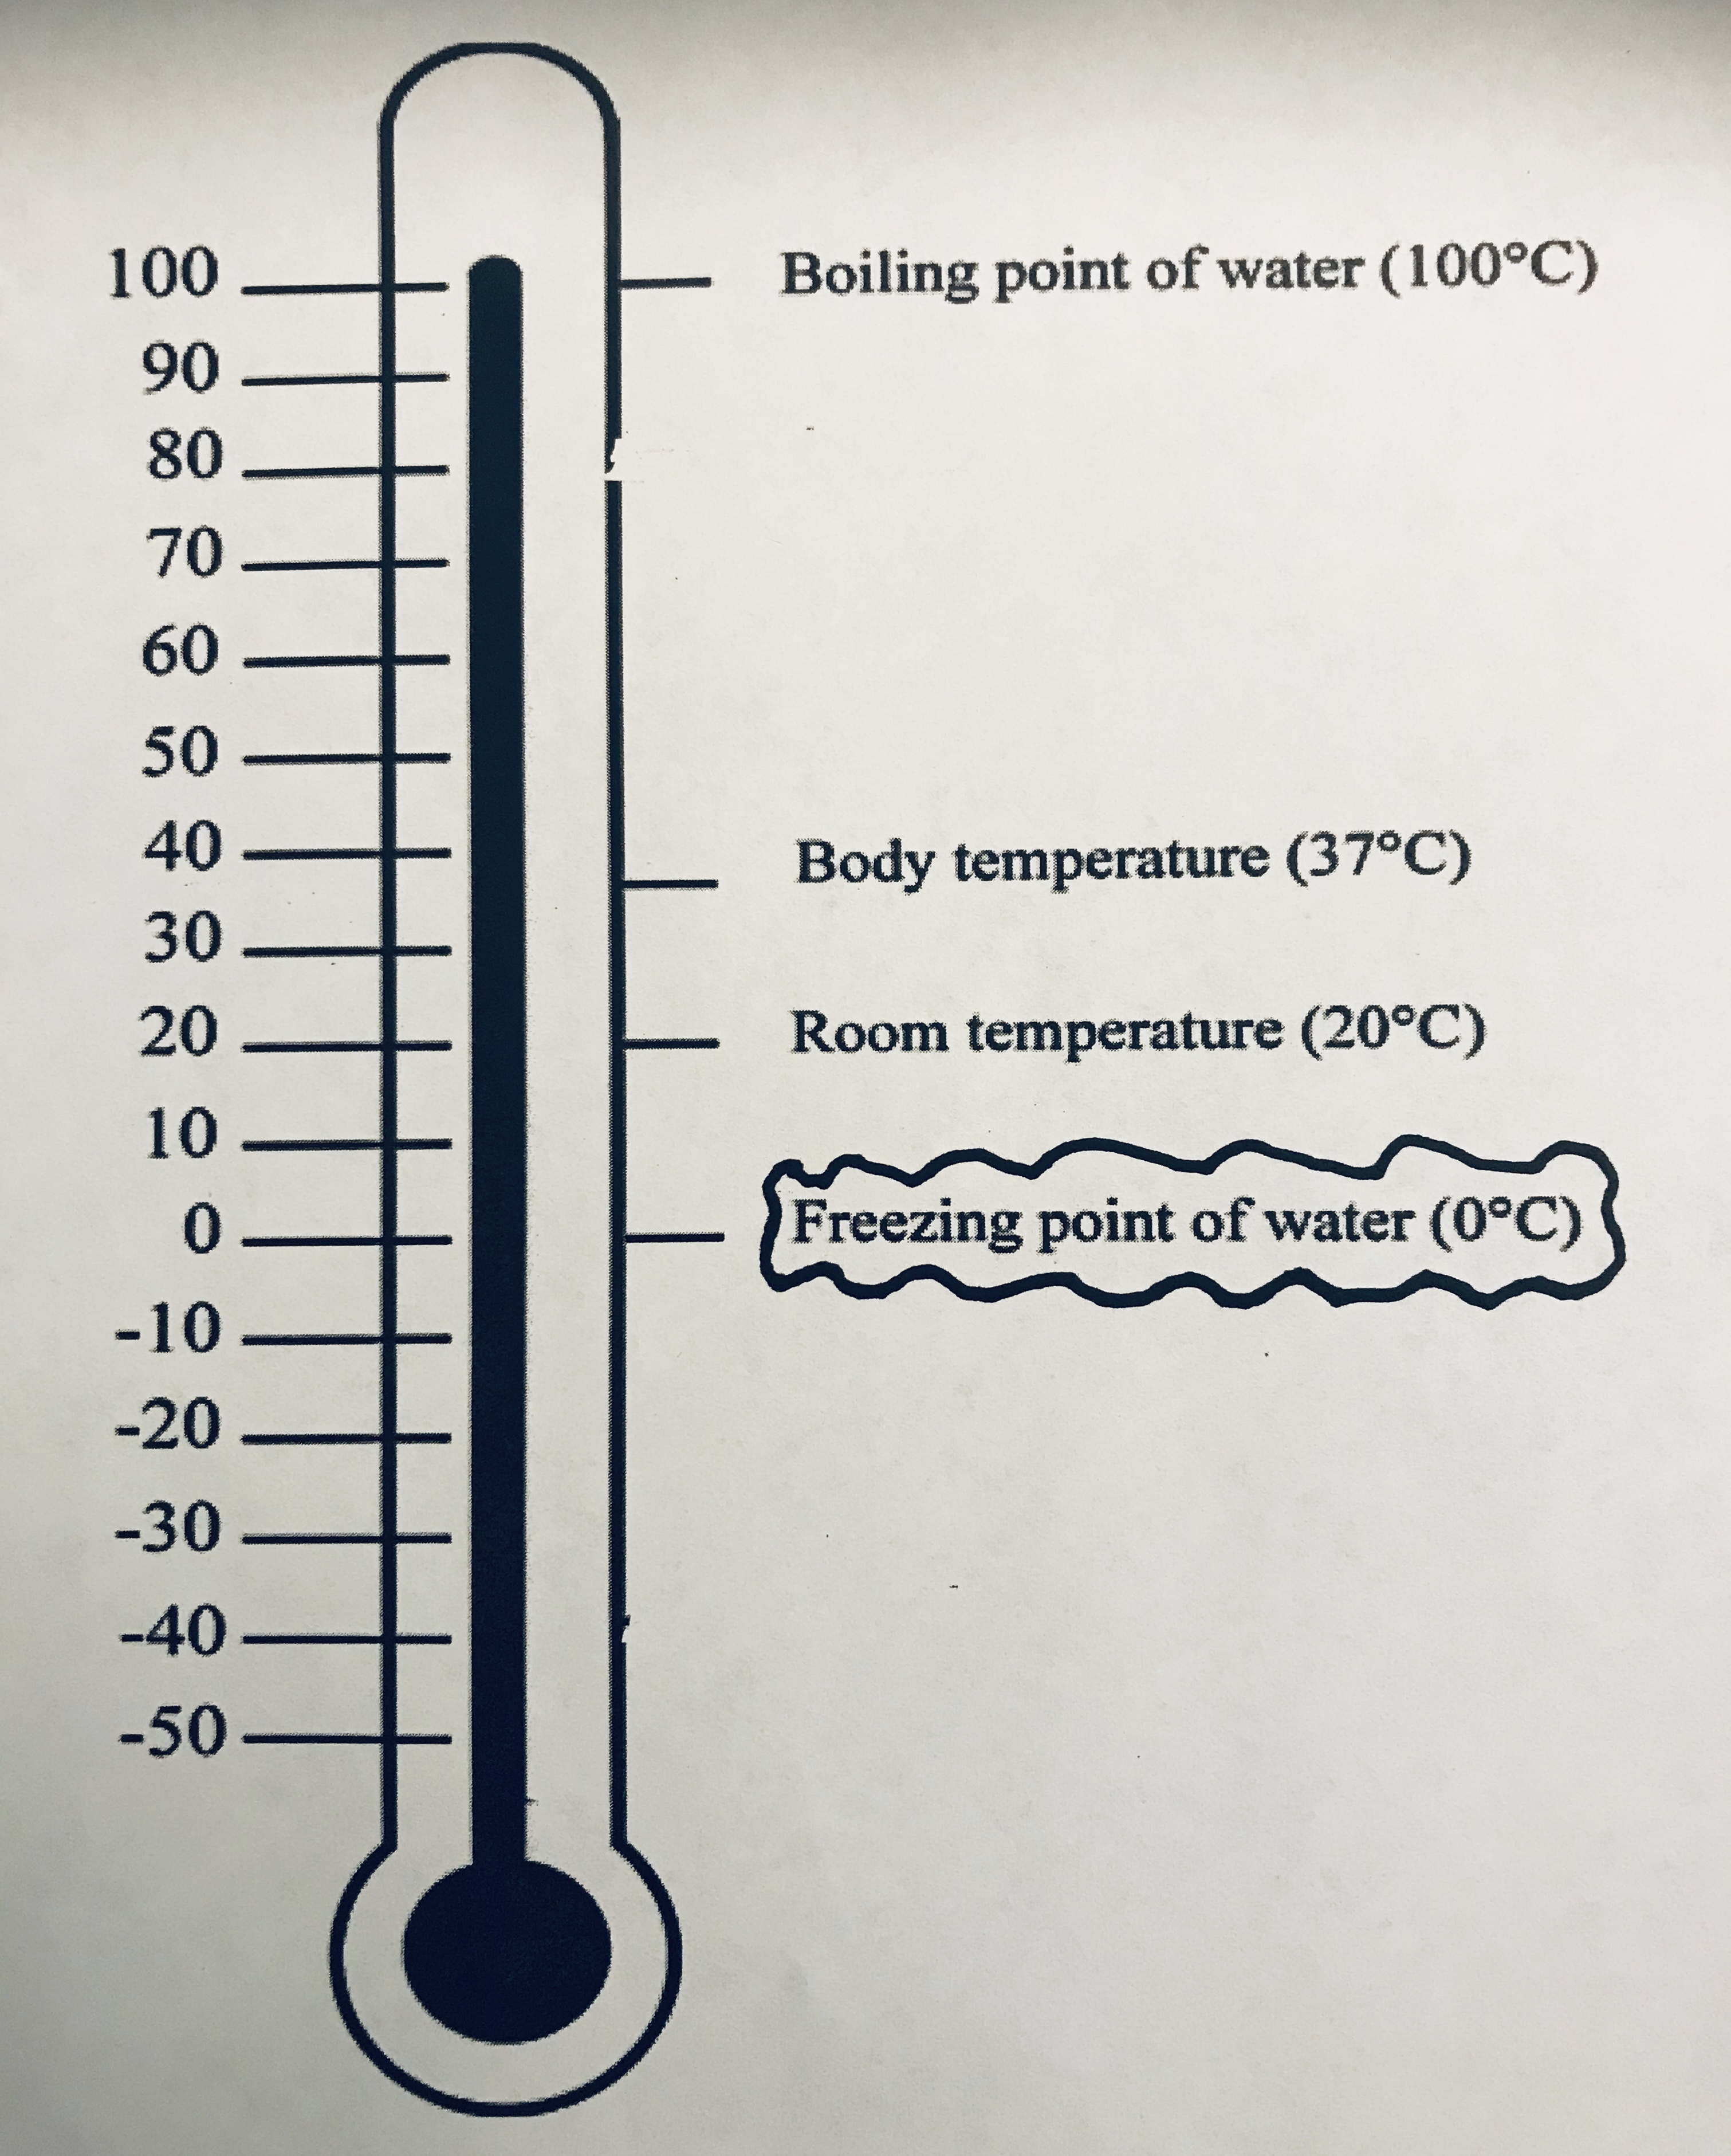
The purpose of the Exploration phase was for students to have hands-on experiences with data so they could begin to develop conceptual understanding of the relationship between temperature and change of state and between change of state and conservation of matter. The two explorations described below help achieve these goals for hands-on learning from data; however, before beginning the investigation, we looked at a picture of a thermometer (see Figure 2). The thermometer helped students understand negative values and were similar to ideas students developed in earlier grades using number lines. The picture introduced the freezing point of water as zero that and temperatures can go below zero degrees Celsius. Also during this time, students reviewed how to make measurements using digital thermometers and digital scale.
Coffee Creamer in a Container of Ice Water
I talked through the procedure we would carry out in the investigation. Each student would have the materials to do the investigation. In addition, each student would wear safety goggles and was told not to open and drink the creamer. Students would be taking multiple measurements before and after the investigation. All of the supplies were provided before the investigation that included the following steps:
1. Make predictions about the temperature of the coffee creamer and water before and after the investigation. Record predictions on data sheet.
2. Open up one of the coffee creamers and take the temperature (this coffee creamer is set aside. Students receive additional coffee creamers to conduct the exploration). (Teacher Notes. This data will be used to determine whether the temperature of the creamer changes over time (see Step 9). This data can also be compared to see if the temperature of the creamer changes as much as the temperature of water over time (see Step 7).
3. Measure the mass of a closed coffee creamer (approximate volume 13 ml). Students use digital scales that are set-up in five stations around the room. No more than five students to a station (Teacher Notes. This data helps student explore whether mass is conserved during a phase change (Step 8). The mass measure will include the mass of the container.)
4. Fill a sealable container with 300 ml of cold distilled water and 25 ice cubes. Students should use measuring cups to measure the volume of water from a container of distilled water.
5. Take the temperature of the water/ice container.
6. Add the closed coffee creamer to the water/ice container.
7. Shake the container and leave it sealed for eight minutes.
8. Take the temperature of the ice/water bath. Record temperature measurements on data sheet.
9. After eight minutes, measure the mass of the coffee creamer from the water/ice bath.
10. Open up the coffee creamer that was in the water/ice bath and take the temperature.
In science notebooks, students record wonderings and questions about the investigation.
I wanted students to address essential science practices associated with analyzing and interpreting data and crosscutting concepts dealing with patterns, such as recording information through observations and use observations to describe patterns and relationships to answer scientific questions (NGSS Lead States 2013, Appendixes F and G). These data points would work in tandem with students’ experiences in the next exploration to help them construct evidence-based claims. (See Online Resources for investigative setup and representative data. The website shows a slightly different procedure so that teachers and students can see how the temperature changes over time and have multiple data points. In class, students only measured the mass and the temperature of the coffee creamer before and after the investigation and the temperature of the water before and after the investigation. We used the video data so that we could observe temperature changes over time at each minute for eight minutes).
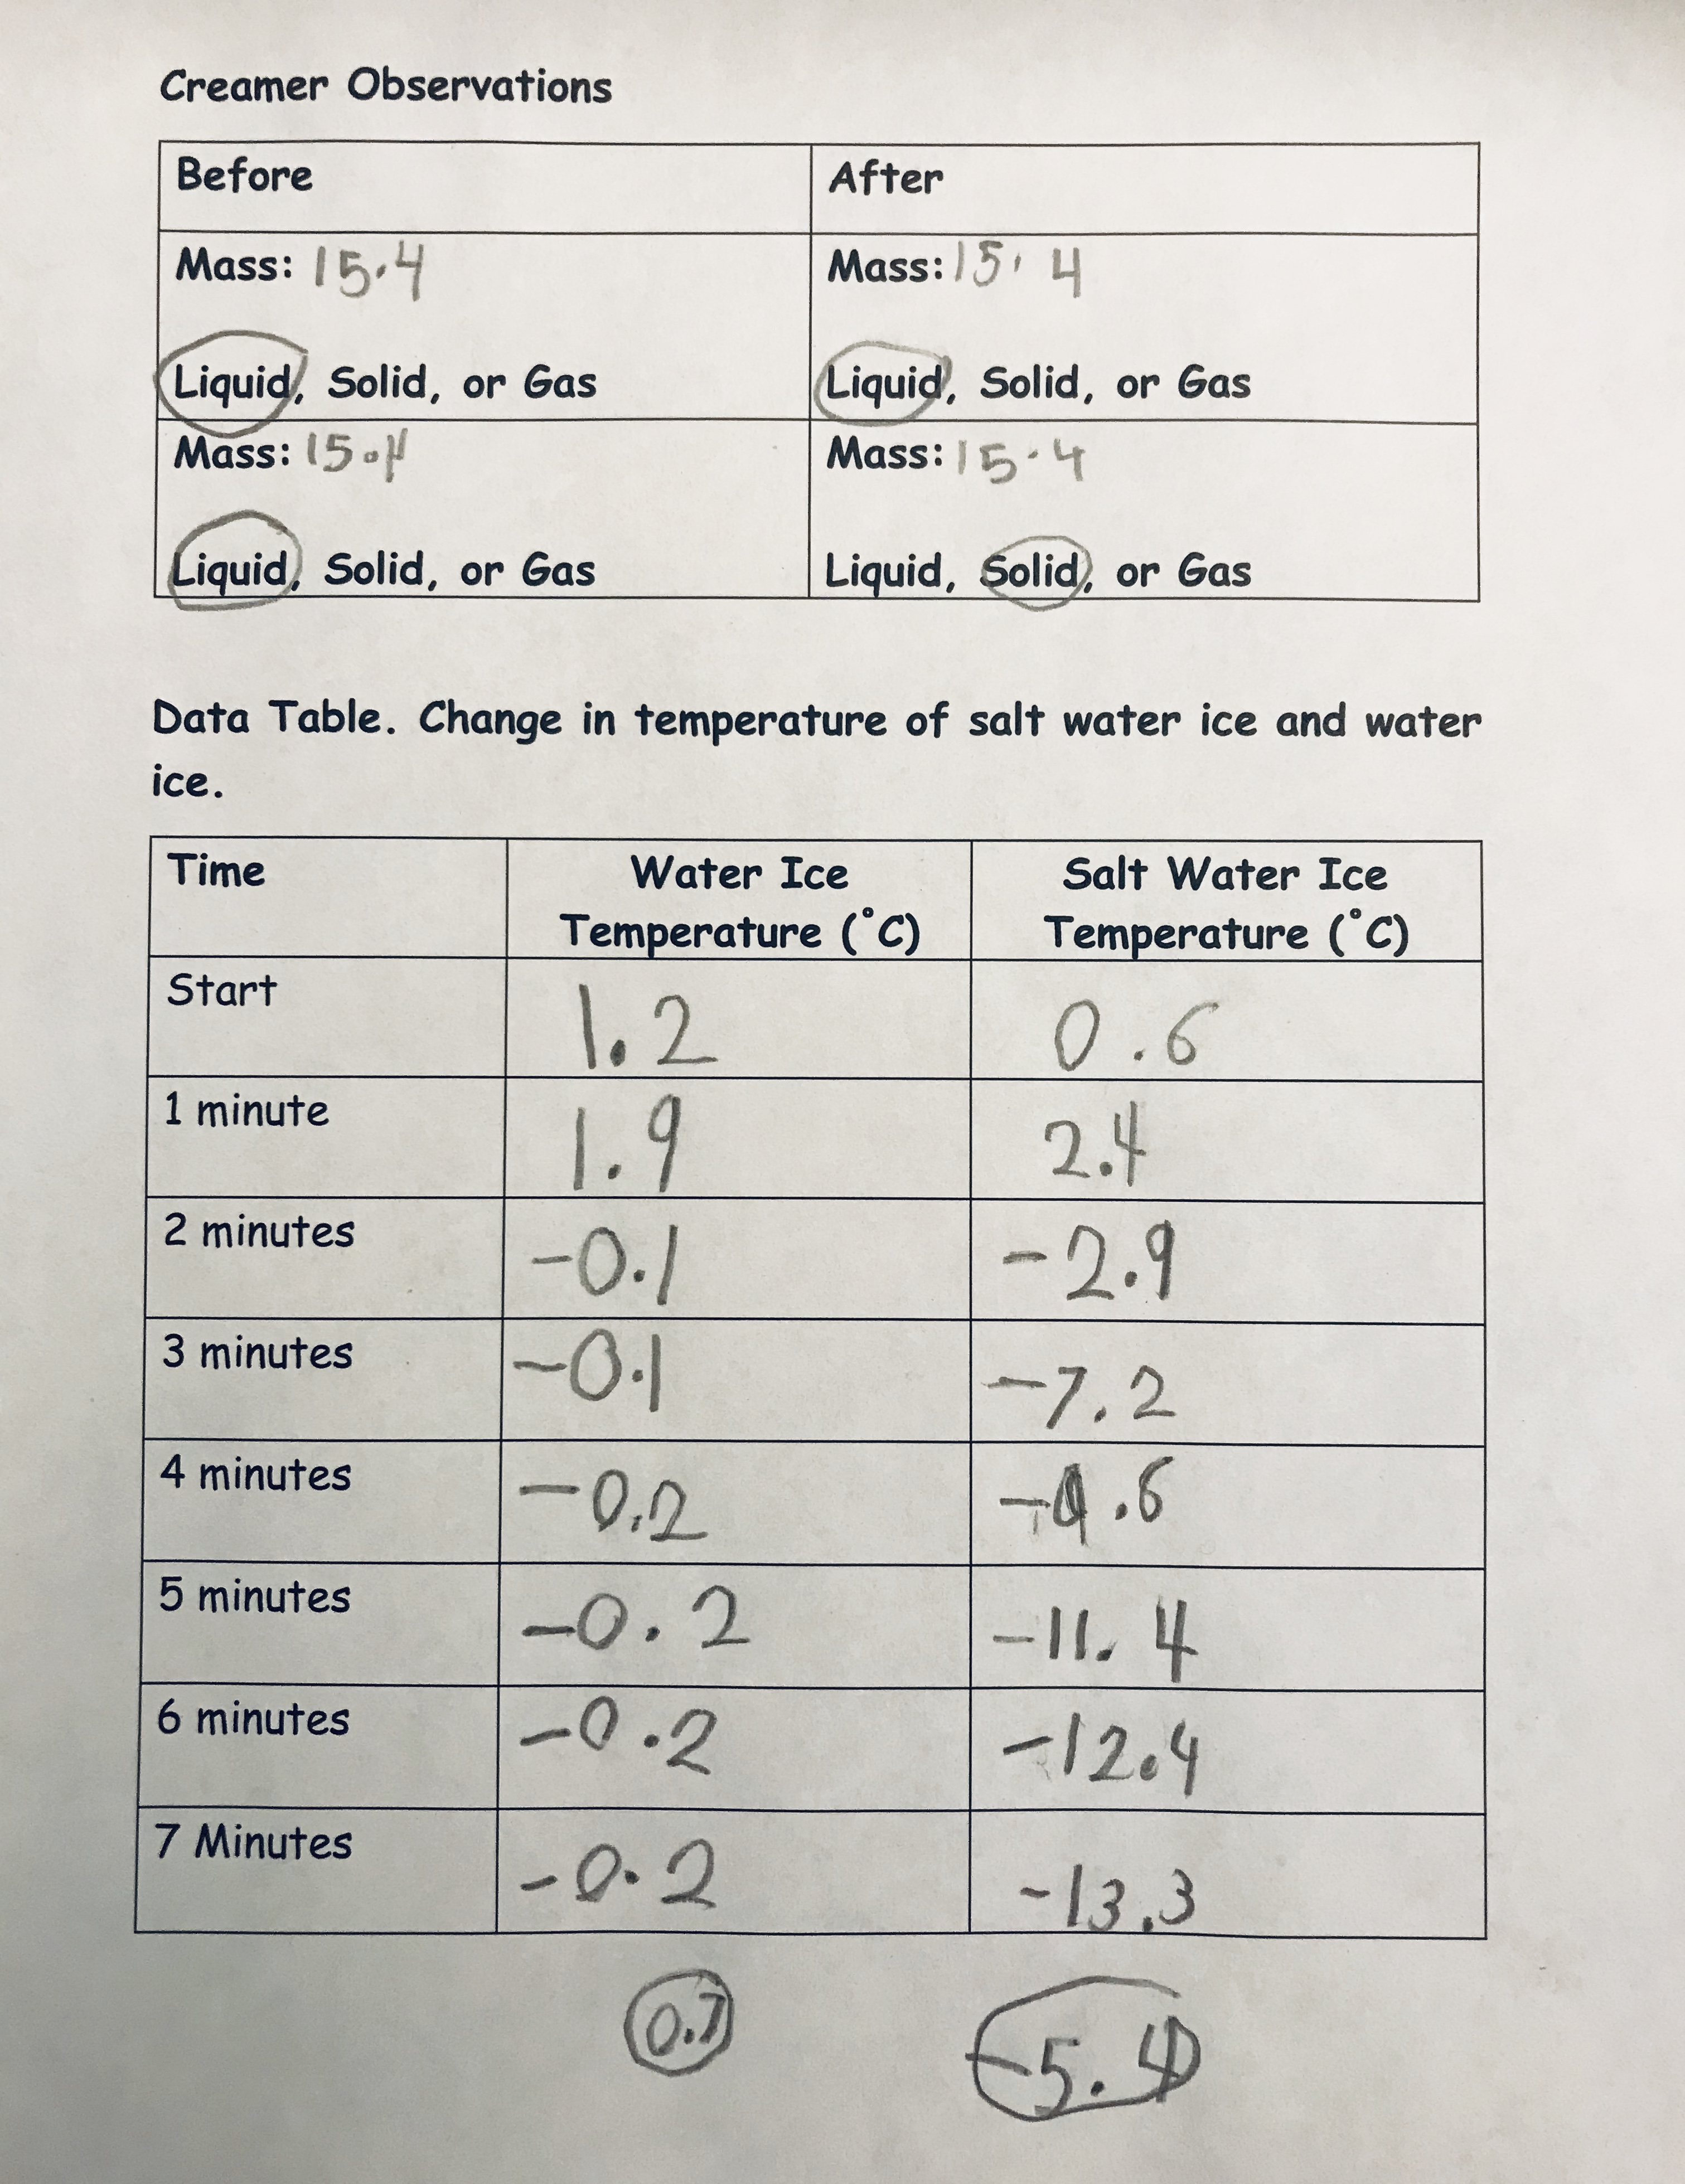
Students found the coffee creamer weighed approximately 15.4 grams. Also, students opened a coffee creamer and took its temperature. Students made the qualitative observation the coffee creamer was a liquid. The starting temperature was 1.3 C (34.34 F). I asked students to use a sticky note to predict what they thought would happen to the mass and temperature of the coffee creamer overtime. Most students thought the creamer would weigh more. With students’ ideas recorded on sticky notes, it was time to begin. To students’ surprise, the temperature remained relatively constant and less than 1 C (33.8 F) (actual temperature hovered between -0.1 and -0.2C, [32.18 F and 32.36 F, respectively]) (see Figure 3).
I related the decimal values to what students were learning about quantities formed when a whole is partitioned into equal parts (e.g., CCSS-Math) (NGAC and CCSSO 2010). I had students round their decimal values to the nearest whole number so they could make evidence-based claims that made sense to them. Many students mentioned their predictions were incorrect and the temperature did not continually decrease as they thought. When we took the mass, students were also surprised that the weight did not change. We opened the coffee creamer to find a liquid that was 0.7 C (33.26 F). The coffee creamer results were anticlimactic, as expressed by Hayden, who asked, “Was nothing supposed to happen?” I wanted to capitalize on the data we had and asked students what claims could we make based on the data collected. As a class, we observed a temperature change over time. Even though the temperature changes, the decrease was not enough to change the state of matter from a liquid to a solid. Also, the volume remained the same and did not change with changes in temperature. I reminded students that their initial predictions were incorrect. Thus, students were learning essential concepts (e.g., temperature and change of state and conservation of matter).
Coffee Creamer in Container of Cold Salt Water
(Teacher Notes. In this exploration, the coffee creamer will change state from a liquid to a solid and students will have ice cream—this is why coffee creamer versus a different material was used): The second exploration followed nearly the same procedure and every student performed the investigation. The only difference was that we added approximately 57 grams (2 ounces) of salt to the water ice mixtures (see Online Resources). Again, we took the temperature before and after; however, this time the excitement in the class rose to a new level when we learned we had reached -13.3 C (8.1 F) at 8 minutes. Next, we quickly weighed the coffee creamer, which did not change mass (still 15.4 grams) (Note: Teachers should make sure the coffee creamer is dry and not add extra water weight).
I had students bring their coffee creamers out into the hallway. (Teacher note: Students should not eat in the laboratory; they should find an alternative place to eat the ice cream. Also, students with lactose or peanut allergies should not eat the ice cream.) On the count of three, I had them open their containers. One, two, three! The hall immediately was filled with oohs and ahhs and grew into a resounding cheer when I offered each student a spoon and told them they could “eat their ice cream.” Once everyone had enjoyed their small treat, we cleaned up the lab setup and it was time to discuss what we found.
Explain (15 Minutes)
The purpose of the Explain phase was for students to construct an evidence-based claim from their explorations and introduce new ideas in light of their experiences to deepen their conceptual understanding. I wanted students to understand the temperature dependency of the states of matter versus simply memorizing these ideas (reciting solids, liquids, and gases) and that matter is conserved during a phase change. Our explanation unfolded through three different explanatory activities:
Student Evidence-Based Claims
I started by asking students to make scientific claims based on the patterns in the data. I guided students to think about the following questions to help them construct evidence-based claims: (1) How does temperature change in each exploration? (2) Did the coffee creamer change state in each exploration (go from a liquid to a solid)? and (3) Did the mass of the coffee creamer change in each exploration? Students were able to make a series of important claims. For example, Sawyer wrote, “going from a liquid to a solid does not change the weight, and the creamer held at 15.4 grams.” This was a pivotal point in the lesson and was evidence that our objective for learning about the conservation of mass was being met. Next, we looked just at the water ice solution. Ellis stated, “adding ice cools the water to a point, but then the water stays the same (referring to temperature).” Finally, we considered the salt and ice water solution. Kyrie penned, “adding salt lets water get way colder than without it and we had -13 degrees versus like 1 Celsius.”
Students also noticed that whether the coffee creamer changed states is temperature dependent, as Blake said, “The colder salt water turned the creamer into a solid and the regular water did not.” I was pleased with the student’s evidence-based claims because they represented accurate scientific ideas based on data. In addition, the claims based on evidence supported students English Language Arts learning and they were developing their ability to support their informative statements with facts (NGAC and CCSSO 2010)
Informational Reading
Once students made evidence-based claims, students took their place on our reading rug and I read aloud What is the World Made Of? All About Solids, Liquids, and Gases (Zoehfeld 2015). The book reinforced what students were learning while also adding scientific ideas about how solids, liquids, and gases are different. After reading, I headed to the whiteboard and asked students for examples of solids, liquids, and gases. As students offered ideas, I wrote them down. The class generated the following list:
- Solids: Ice, wooden blocks, metal, door;
- Liquids: Water, soda and other beverages;
- Gases: Air and water vapor.
Underneath the examples, I asked students to explain how each was different. Finley explained solids and liquids are different and, “Solids keep form no matter what except if you hit them with a hammer they will break, but still be in small pieces.” Charlie chimed in with liquids are unique and if “you spill milk on the floor, it goes all over and doesn’t have a clear path.” Finally, Lennon said, “most gases you can’t see or really feel and they go everywhere.” These ideas all focused on the shape of solids, liquids, and gases. I was also pleased to hear students were understanding the relationship between state of matter and temperature. Kyrie commented, “Water is either a solid, liquid, or gas because of its temperature.” Thus, students were using ideas from the reading to develop a more sophisticated scientific understanding of the differences between phases of matter.
Elaboration and Evaluation
The purpose of the Elaboration phase (e.g., apply what they learned) and Evaluation phase (self-assess understanding) were to develop deeper conceptual understanding. I wanted to revisit the initial preassessment and determine if students could apply what they learned from their hands-on experience to the preassessment probe. I had students consider why we add salt to the roads before it begins to snow based on their experiences with change of state. The conversation that follows unfolded:
Teacher: What happens when it starts to rain and the temperature is above zero degrees Celsius, will we have rain or snow?
Blake: We will have rain because
Teacher: Why
Blake: Because it is too warm?
Teacher: What about if the temperature drops to zero, what will happen to the precipitation?
Charlie: The water will turn to snow.
Teacher: Now, let’s say you throw salt down on the ground before it starts to rain. What will happen to the rainwater as it mixes with the salt? Will it
freeze at zero?
Blake: No!
Teacher: How do you know from the lab it won’t freeze at zero?
Ellis: Because it got super cold, like -14 degrees.
Charlie: Yeah, it got so cold it made ice cream (referring to freezing the
creamer).
Elliot: When the water ice would not freeze it (referring to the creamer).
The conversation engaged students in scientific discourse that help them make connections between their prior ideas in the assessment probe and their firsthand experiences with data that served as evidence for the phenomena. In the future, I would have all students write a reflection on their developing understanding. Reflection on prior knowledge and new ideas helps develop conceptual understanding about how doing science in valid and reliable ways is an important part of learning science.
Conclusion
The ice cream lesson is one step to students better understanding change of state and temperature. The benefit of the 5E and this lesson is that students’ experiences with data and evidence in a meaningful context serves as their frame of reference for understanding these phenomena and helps promote deeper conceptual understanding and transfer learning. Using the 5E instructional sequence ensures students are constructing knowledge based on firsthand experiences with data and evidence. In addition, the 5E requires students to use the special unification of SEPs, CCs, and DCIs, to know and understand the phenomenon. The result is that students gain higher levels of science literacy because understanding from both explorations and explanations combine to create meaningful learning experiences. ●
Online Resources
Creating Ice Cream in Science Class: https://www.youtube.com/watch?v=D86XOxmPPiE
Supplemental Materials
Download the salty roads formative assessment probe at https://bit.ly/3mcSfsp.
Patrick Brown (plbtfc@gmail.com) is executive director of STEAM and Career Education at Fort Zumwalt in O’Fallon, Missouri.
5E Crosscutting Concepts Disciplinary Core Ideas NGSS Pedagogy Performance Expectations Three-Dimensional Learning Elementary