![]()
![]()
Middle School | Daily Do
Why is Niagara Falls moving?

Crosscutting Concepts Disciplinary Core Ideas Earth & Space Science Is Lesson Plan NGSS Phenomena Science and Engineering Practices Three-Dimensional Learning Middle School Grades 6-8
Sensemaking Checklist


Introduction
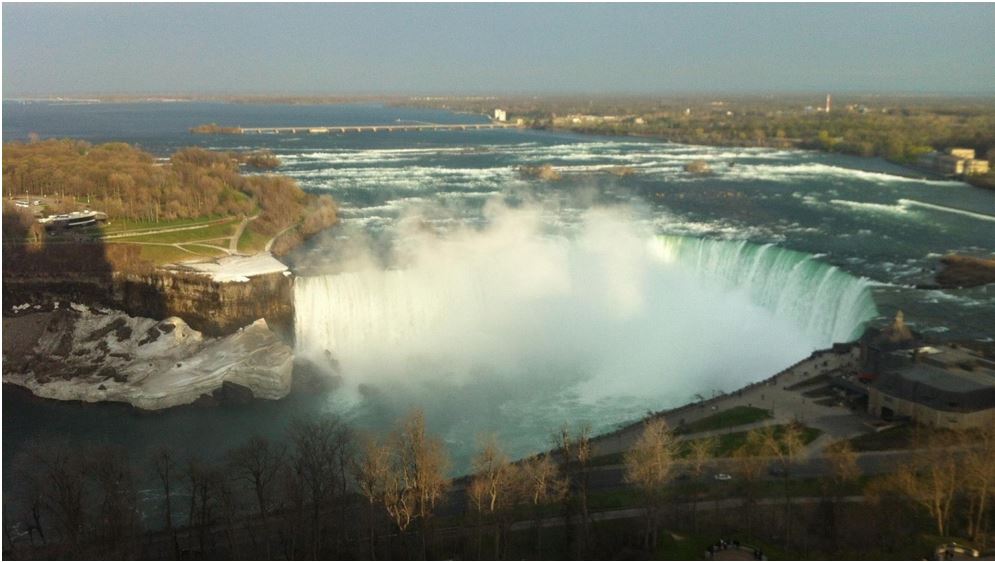
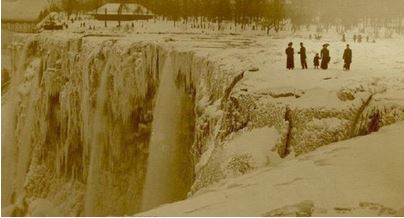
Niagara Falls is one of the great natural wonders of the world. However, the falls have not always looked the way they do now. In fact, even the location of the three falls that make up Niagara Falls - American, Bridal Veil, and Horseshoe Falls - have changed! In today’s task, Why is Niagara Falls moving?, students analyze and interpret data and use the thinking tool of cause and effect to help explain why Niagara Falls has changed location and shape over time.
Experience the Phenomenon
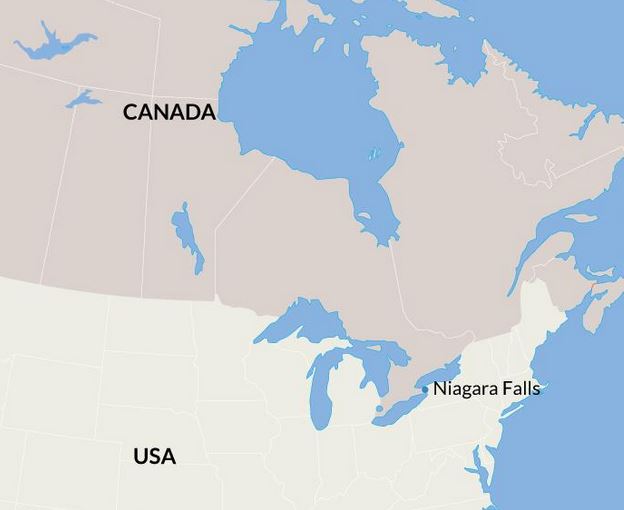
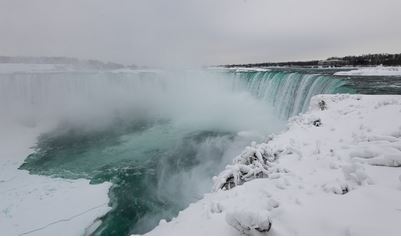
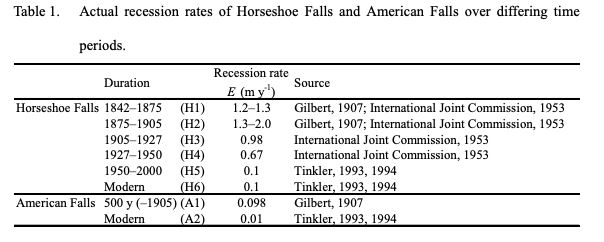
Tell students you have a puzzling phenomenon to share. Ask them to create a Notice and Wonder t-chart in their science notebooks. Share the photos of Niagara Falls with students. You might show their location on a map. Be sure to point out that the photos are taken from opposite directions; the Niagara River flows north. Give them independent thinking time (Alone Zone) to make and record observations in the Notice column and to note any questions they have under Wonder.
Have students share what they Notice and Wonder with their small groups. What observations do they have in common with their group members? Did anyone notice something that no one else in the group observed? Next, ask student groups to develop an initial model to explain why Niagara Falls has moved over time.
As you move around the room, you might ask some of the following questions to deepen students' thinking about the explanation:
- What are the components (parts) of your model?
- How is this component (point) interacting with this component (point)? How could you represent this interaction?
- I see you're representing two different locations of the falls. What happened to the rocks that used to be here? How would you represent this on your model?
- I see you included broken rock in your model. How did the rock break? How could you represent the interaction you described on your model?
- Do you think all the pieces of rock are carried away? Why? How could you show what you just explained to me on your model?
- I see you are showing water breaking rock. How is the water breaking them? How might you show this on your model?
- Do you think rock breaks in the same way in summer and in winter? How might you represent the different ways the rock breaks in your model?Upon completion, ask each group to share their model with the class. This can be achieved using a Scientists Circle where each group briefly shares their model or a gallery walk where one student stays with the model and the other group members travel from group to group. Ask students to record similarities and differences between their model and the other group models. Consider giving students an opportunity to ask the other groups clarifying questions (if using a gallery walk, students can use sticky notes to post their clarifying questions directly on the group models.)
Create a class consensus model. Begin by asking students to point out the common components between the group models. While developing a class consensus model, make sure students agree to the addition of each component and their interactions. If students do not agree on a component or interaction represented, ask if you can use a question mark or draw with a dotted line to represent things the class is unsure of or doesn't agree on.
Provide students time to review their questions and add to or revise them based on the class model. Create a physical or digital space for students to post their questions. You might proceed by asking one student to share the first question. Then, ask students to raise their hand if they feel their question is connected to the one that has just been presented. These students can then share and post their questions in the same area of the driving question board. Once all related questions have been posted, ask a student to volunteer to share the next question. This process allows for all students to share questions and easy organization /categorization of questions on the driving question board.
Common questions:
-
Why does the shape of the falls keep changing over the years?
-
Why do the falls change (move) more sometimes than others?
-
Will the falls keep moving forever? (End up in another state)
-
Does the US-Canada border move with the falls?
-
Do the falls move a little at a time or do big chunks fall off at once?
-
Is there a way to keep Niagara Falls from moving?
Additional Guidance: As students work in small groups, listen for students using prior knowledge and personal experience to explain the phenomenon. Also listen for common misconceptions. At this point in the task, it is important to resist the urge to correct misconceptions! Instead, allow students to build on/change their own thinking as they move through the task.
Plan and Carry Out an Investigation
Share the following quote with students:
According to the International Joint Commission, the movement of Niagara Falls is more rapid when it is in a V-notch shape than when it is spread out.
Ask students to turn to a partner and share ideas about why the shape of the falls might affect their movement. Push their thinking further by asking if there are factors besides shape that might play a role in the rate Niagara Falls moves. Remind students where Niagara Falls are located. You might even show them the images below. Consider moving from partners to small groups. This is a great opportunity for students to discuss and compare idea.
Bring students back together and ask them to share factors that might affect the rate the falls moves. Students might share (with suggested follow up questions)
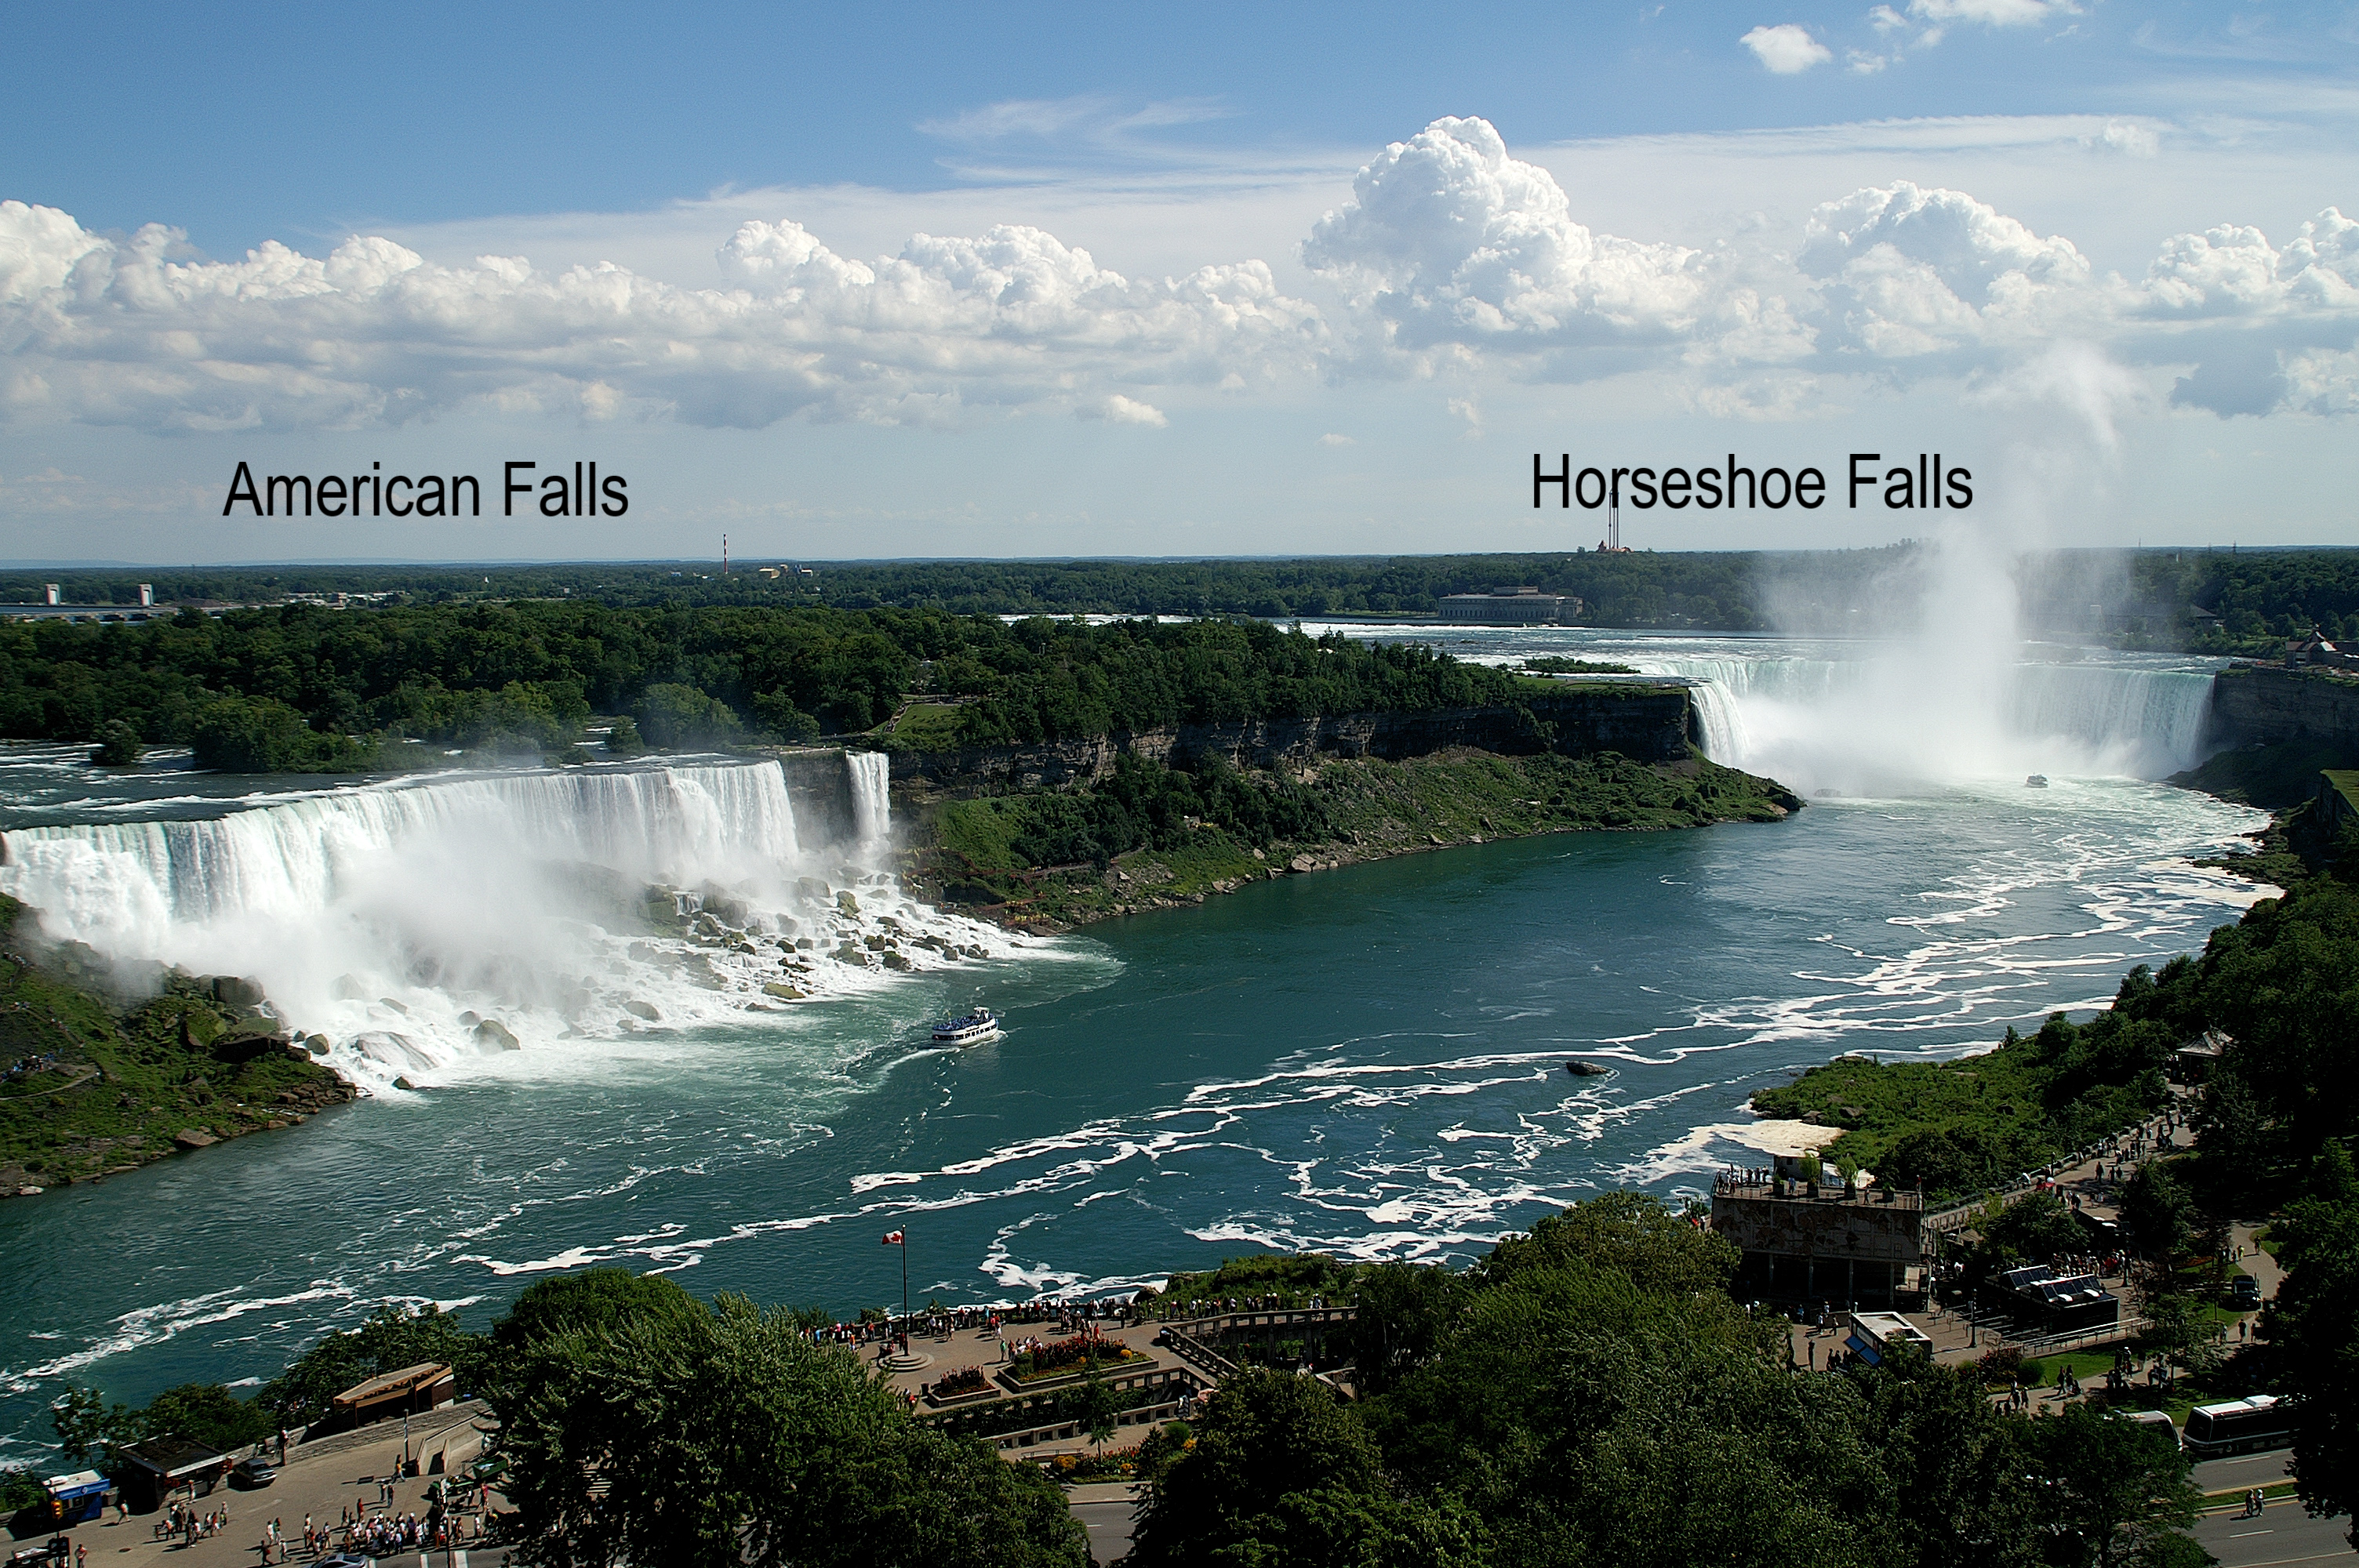
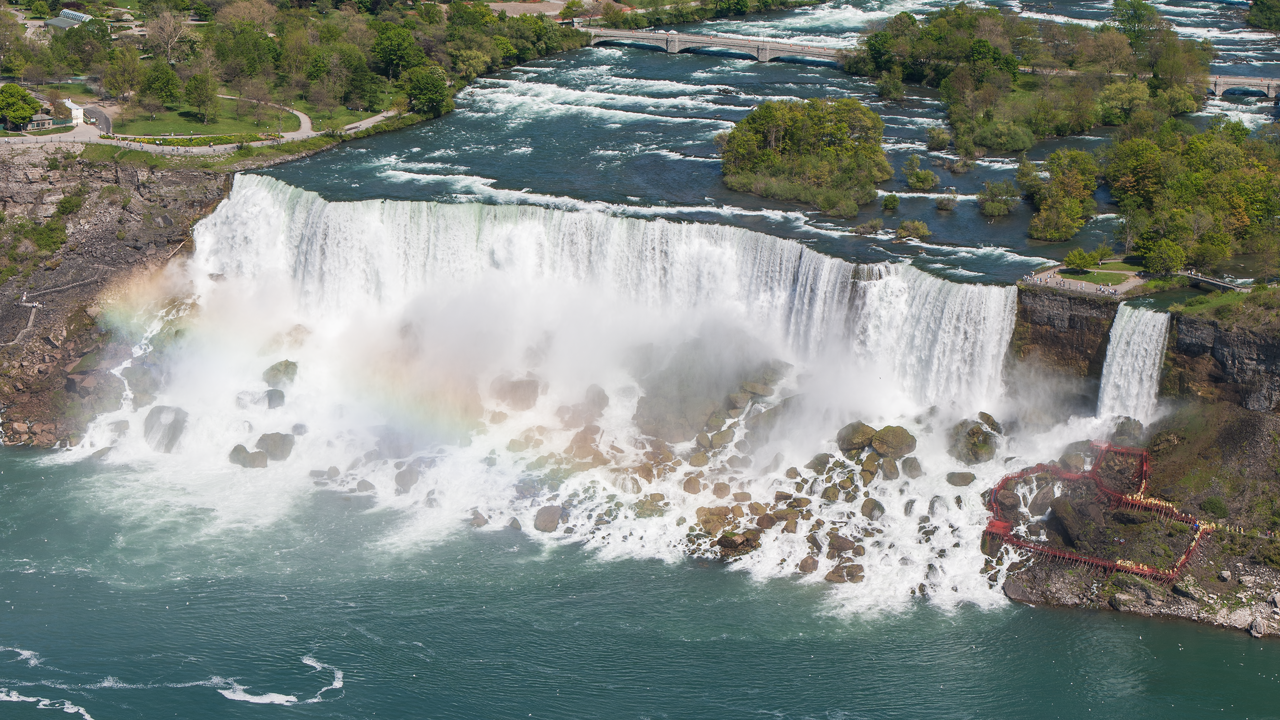
- shape of falls (What shapes could the falls have? [Refer to images]) straight, curved, V-notch
- how much water is going over (What might change the amount of water flowing over the falls?) amount of rain, amount of snow, how fast snow melts, putting a dam in
- how broken up the rock is (Why might the rock be more broken up sometime than other times?) how much ice there is in winter to break them, acid rain, fast water carries bigger rocks that could cause more breaking when the water flows over
Engage students in an investigation utilizing a stream table or a simple set-up of sand and water. You might ask half the class to investigate how shape affects the rate of falls movement and the other half investigate how the amount of water flowing affects the rate of movement.
Provide an opportunity for student groups to share their data with the class. Ask students to identify patterns in both "shape" data and "flow" data. You might revisit the class consensus model and ask students to discuss in their small groups if they would add to or change the model. Bring the class back together and ask small groups to share their thinking. Do we still need this question mark? Can we make these lines solid now? Are there places we need new question marks/dashed lines?
Additional Guidance: Make sure to discuss the limitations of the stream table model. The stream table uses sand, which represents rock that has already been weathered. The falls need to be weathered before erosion occurs. Also consider prompting students to think about the difference in water being funneled into a narrow funnel versus flowing over a wide area to figure out why erosion would be faster at a ‘V’ shape versus a ‘U’ shape. If stream tables are not available consider showing a video of a stream table investigation like this Erosion lab video (see 4:25 - 5:00). Have students make predictions before showing the video, drawing on prior knowledge about/experience with erosion.
Note: Both weathering and erosion need to happen for the falls to move. To further consider the role of weathering in the movement of Niagara Falls, you might have students work through a series of short weathering activities like the ones described in this weathering and erosion lesson from understandingscience.org.
Analyze and Interpret Data
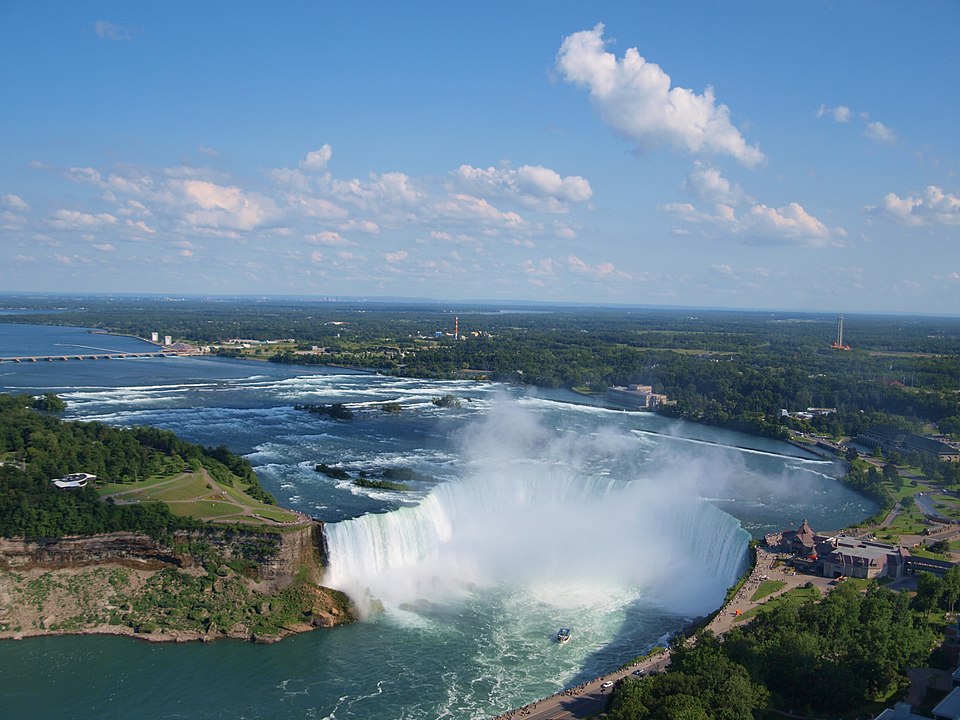
Introduce three data sets to students, Actual recession rate of Horseshoe Falls and American Falls over differing time periods, Historical changes in flow discharge over Niagara Falls, and Historical changes in lip length of Horseshoe Falls, and ask them to look for patterns in each data set and patterns between the data sets. Encourage students to compare both data sets with the shapes of the two falls (see pictures below). Ask students to share what they notice, first with a partner and then with the class.
Students will likely notice the following patterns:
- Horseshoe Falls' recession rate increased then decreased over time
- American Falls' rate of recession decreased over time
- Horseshoe Falls recedes faster than American Falls
- Flow discharge decreased over Horseshoe Falls and American Falls between 1842 and the present
- Horseshoe Falls has a higher discharge rate than American Falls
- As Horseshoe Falls lip length increased, the recession rate decreased
- U-shaped falls have faster recession rates than straight falls
Guidance: You may need to take time with middle school students to make sense of the Actual recession rate data table, especially the units (meters per year or meters/year). You might ask them to compare the size of the data intervals (Duration) between Horseshoe and American Falls. Do they think American Falls ever receded as fast as Horseshoe Falls? Why or why not?
Provide students with this additional piece of data:
According to niagaraparks.com, the recession rate has been greatly reduced due to flow control and diversion of water for hydro-power generation. Its current rate of erosion (recession) is estimated as 0.3 meters per year and could possibly be reduced to 0.3 meters per 10 years.
Ask students to think back to the class ideas about factors that affect the rate of erosion (recession). Could any of the other factors explain why the recession rate has decreased over time? Tell students to turn and talk with a partner to share ideas. Ask them to consider what additional data they might need to provide evidence to support their ideas. Students might say the amount of rainfall/snowfall might have decreased over time; they could look at historic weather data. Other students might wonder if people are using the water for drinking or irrigation. Researching sources of drinking water for towns along the Niagara River would provide data to support or refute this idea.
Tell students to return to their small groups and identify components, interactions and/or science ideas the class should add to/change on the class consensus model. Bring the class back together and ask small groups to share their thinking. Do we still need this question mark? Can we make these lines solid now? Are there places we need new question marks/dashed lines?
Refer students back to the driving question board. Ask them to identify question they can now answer or partially answer. Based on remaining question marks/dashed lines on the class consensus model, ask "What do you think we should investigate next?"