![]()
![]()
feature
Strategies to Increase the Workforce Development of Interdisciplinary Cohorts of Traditionally Underrepresented Students in STEM
Journal of College Science Teaching—November/December 2021 (Volume 51, Issue 2)
By Joanna Joyner-Matos and Kayleen Islam-Zwart
This article presents results from a Scholarships in STEM (S-STEM) grant from the National Science Foundation that supported students from three majors and funded the development of cocurricular activities designed to increase the workforce development of first-generation and underrepresented students. Scholar cohorts were interdisciplinary, with students majoring in biology, chemistry, and environmental science. We present details from four categories of activities: library resources and information literacy, career services, professional development, and community engagement. We discuss how the process of designing the activities created collaborations between STEM faculty and student support staff and between faculty and regional employers and nonprofit organizations. Results from formative assessments are presented from the group of scholars as a whole, as we did not detect significant differences as a function of gender, first-generation status, race or ethnicity, or academic major. Overall, the community engagement events were rated more poorly than other activities because they were viewed as contributing less to gains of knowledge or skills. Finally, we found that how the scholars viewed the activities depended more on how we discussed the activities with them than on the scholars’ academic or demographic features.
The proportion of STEM jobs in the American workforce is expected to increase over the next decade by nearly 9%, while the total workforce will expand by only 5% (Bureau of Labor Statistics, 2019). The degree to which American colleges and universities are preparing graduates for these positions is unclear, with some reports indicating a mismatch between the anticipated workforce needs and the production of competitive graduates (President’s Council of Advisors on Science and Technology, 2012; Hart Research Associates, 2013; National Academies of Sciences, Engineering, and Medicine [NAS], 2016; Government Accountability Office, 2018) and others questioning whether this mismatch exists (Smith, 2017; Camilli & Hira, 2019). Regardless of whether applicant and position numbers will match, the overall competitiveness of American STEM graduates is weakened by two factors: persistent issues with diversity in the STEM pipeline and the lack of interdisciplinary experiences. The “leaky pipeline” phenomenon is well documented with respect to gender (Beede et al., 2011; NAS, 2018), LGBTQ+ status (Hughes, 2018; NAS, 2018; Kilgo et al., 2019), race or ethnicity (NAS, 2011), socioeconomic and/or first-generation status (Terenzini et al., 1996; Pascarella et al., 2004; Padgett et al., 2012; Stephens et al., 2012), and the presence of a disability (Hwang & Taylor, 2016; National Science Foundation, 2017). Few STEM degree programs include curricular or cocurricular experiences that are interdisciplinary (Karsai et al., 2011; Lorsch & Nichols, 2011; O’Brien et al., 2013; NAS, 2016) and prepare students for a workplace in which more than 60% of employers expect college graduates to exhibit discipline-specific and multidisciplinary skills (Hart Research Associates, 2013).
The U.S. government invests an average of $3 billion per year in STEM education programs (Government Accountability Office, 2018). One program that addresses the lack of diversity and the decreased competitiveness of STEM graduates is the Scholarships in STEM (S-STEM) program at the National Science Foundation (funded at $70 million annually). The S-STEM program provides scholarship support to low-income and academically talented students, who are encouraged to reduce the amount of time spent working outside of school. Although the relationship between the number of hours worked and a student’s social and academic integration is not consistent (St. John et al., 2000; Hossler et al., 2008; Pike et al., 2008; Robb et al., 2012), it does appear that the financial stress that leads students to work results in a disproportionate disadvantage for first-generation (FG) and underrepresented students (Engle & Tinto, 2008; Nuñez & Sansone, 2016; Baker & Montalto, 2019). The S-STEM program pairs financial support with the development of support services; the combination is particularly beneficial for those who are traditionally underrepresented in STEM disciplines (Angrist et al., 2009; Chang et al., 2016).
Program overview
Here we describe the services that we developed over a 5-year grant program (2014–2019) for an interdisciplinary cohort of scholars. The program provided scholarships of $7,000 per year for up to 2 years for 52 juniors and seniors who were declared majors in biology (not preclinical), chemistry/biochemistry, or environmental science, or who were double majors with at least one supported major. We focused on juniors and seniors because there had been extensive attention paid to first-to-second-year retention at our institution and nationally (Tinto, 1993; Pascarella et al., 2004; Próspero & Vohra-Gupta, 2007; Attewell et al., 2011; Padgett et al., 2012; Stephens et al., 2012), but relatively less to keeping students in STEM majors (e.g., Nora et al., 2005). Applicants had to exhibit financial need as calculated on their Free Application for Federal Student Aid (FAFSA). Academic promise was determined by a cumulative grade point average of at least 3.0, a short essay that addressed the student’s educational and career goals, and letters of recommendation. Our goal was to create cohorts composed of students who exhibited different levels of academic success and demographic diversity; this approach was intended to facilitate interactions between students (Pascarella et al., 2004; Padgett et al., 2012; Stephens et al., 2012). As indicated in Table 1, we met our goal of creating cohorts that contained academic and demographic diversity.
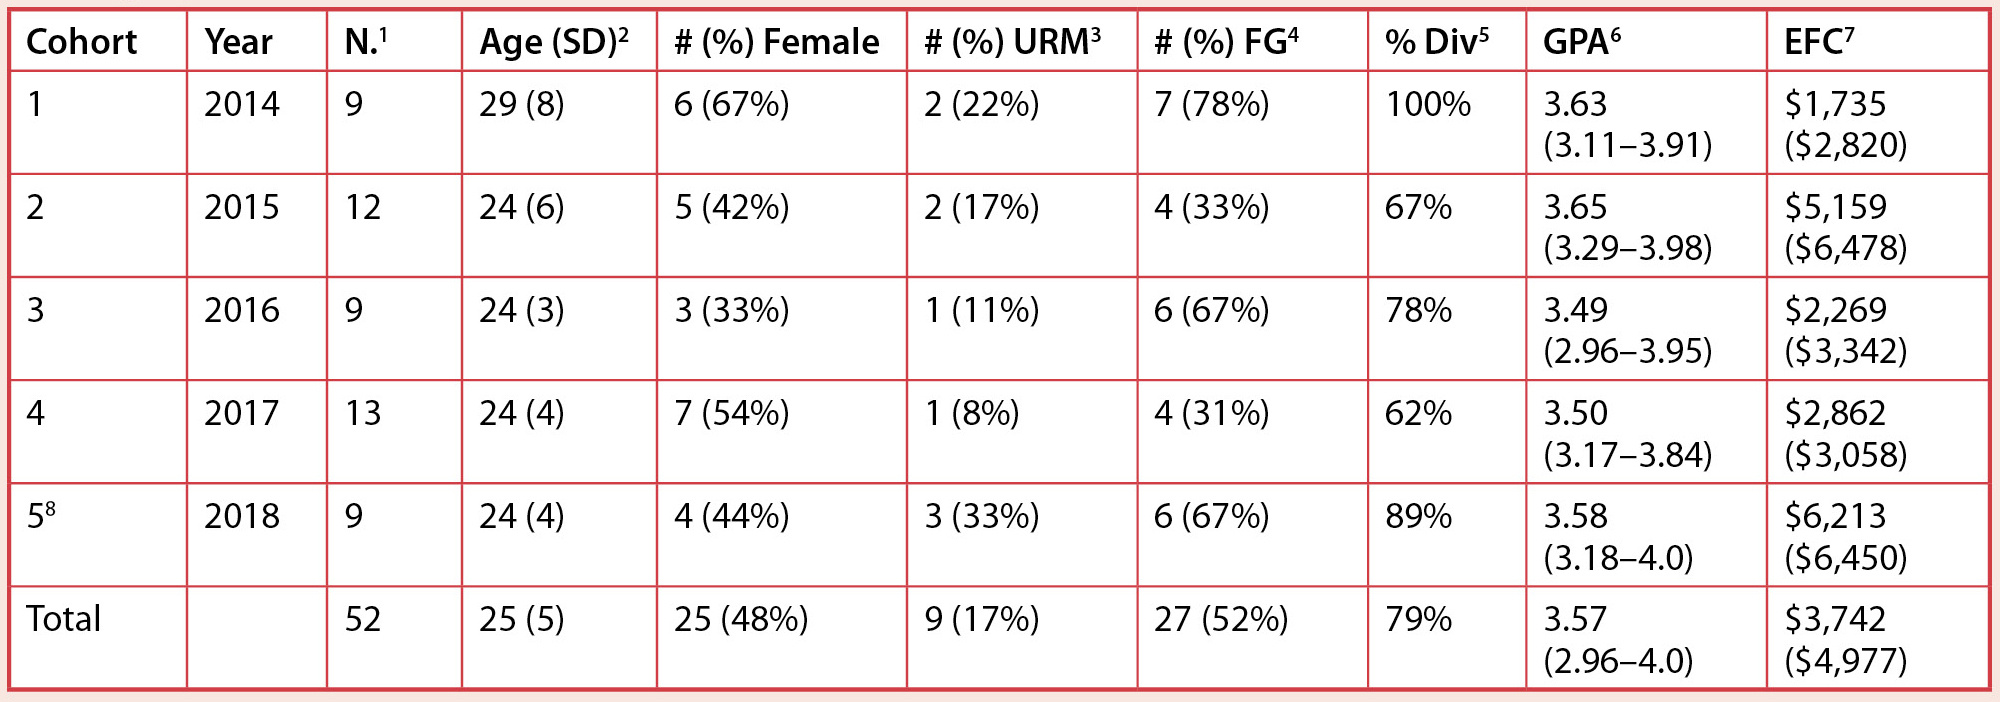
Demographic breakdown of the S-STEM scholar cohorts.
1Number of scholars accepted into the program for that year; not all individuals completed the program.
2Mean age (standard deviation).
3The number (%) that identified into the following underrepresented minority (URM) groups: Alaskan Native, Asian, Black or African American, Hispanic, Latino-Brazilian.
4The number (%) of first-generation college students (FG; neither parent completed a 4-year degree).
5Percentage who exhibit diversity by identifying into at least one category (Female, URM, FG).
6Mean grade point average (GPA; range) during scholarship support period.
7The estimated family contribution (EFC; SD) as reported on the FAFSA; data available for 48 scholars. Mean cost of attendance at our institution is greater than $21,000.
8Scholars in Cohort 5 were supported for only 1 year.
Our institution is a regional comprehensive university that enrolls approximately 12,000 students, most of whom are state residents. We serve a region that is semirural and contains extensive tribal lands. Consistent with previous years, 56% of the student body in the 2018–2019 academic year was female, and students from diverse backgrounds made up 33% of the student body; 43% of the student body was first generation and 72% received financial aid. The College of STEM (CSTEM) is the largest college at the university, with declared STEM majors constituting approximately 30% of the undergraduate student body.
The demographics of the S-STEM scholars were indistinguishable from those of the potential applicant pool in nearly all categories. Potential applicants (> 300/year) were all of the juniors and seniors in the declared majors who had a cumulative GPA of at least 3.0. The only significant difference between the scholars and the potential applicants was GPA; the mean S-STEM scholar GPA was significantly higher than that of the potential applicants (applicant’s mean GPA was 3.38 versus scholar mean GPA of 3.57; Mann-Whitney U test, p < .001). We achieved our goal of building interdisciplinary cohorts (Table 2). All five cohorts contained students from at least three of the degree programs. Patterns in the distribution across majors reflect the patterns in the potential applicant pools, which averaged more than 200 biology majors, 40 chemistry majors, and 30 environmental science majors.
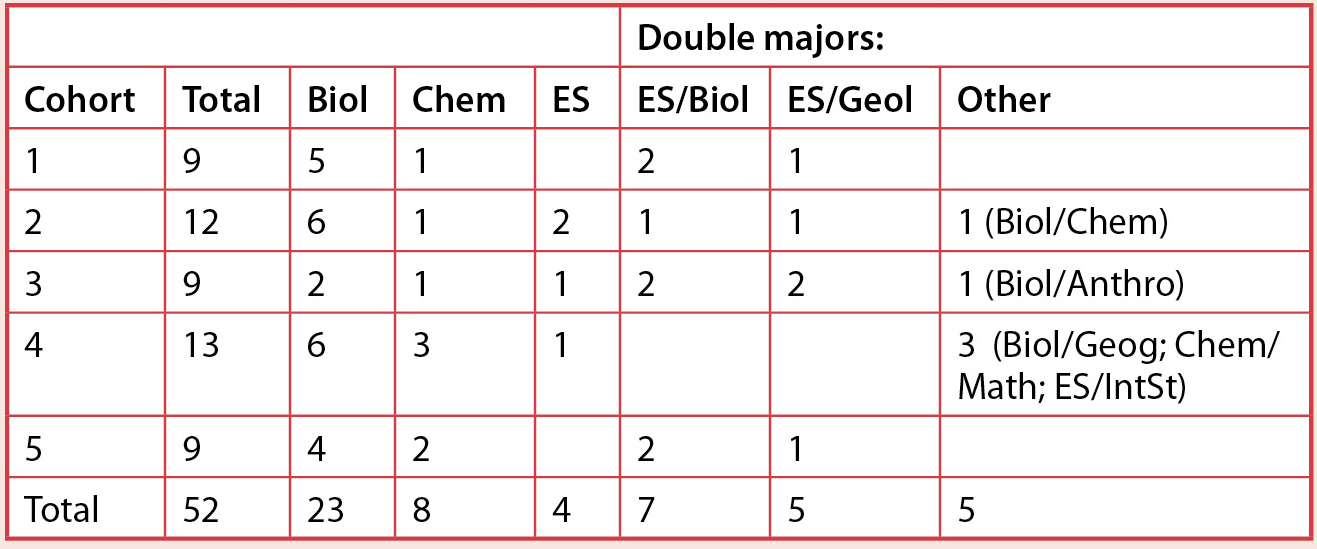
Academic majors of students in each cohort.
Abbreviations: Anthro = Anthropology; Biol = Biology; Chem = Chemistry; ES = Environmental Science; Geol = Geology; IntSt = Interdisciplinary Studies. Students from biology and chemistry were in multiple degree tracks, both general degree program and specialized tracks, including biotechnology and education.
We present details from four categories of support services: library resources and information literacy, career services, professional development, and community engagement. Other program components not described in this article are social activities and increased faculty mentoring (Chesler & Chesler, 2002). Formative assessments were administered via paper surveys that were distributed and collected at the end of each event; if scholars attended events on different days, the assessments were available outside the program director’s office. Surveys were analyzed by the external grant evaluator. The assessments contained 10 questions that remained the same across events, with a 4-point scale ranging from 1 = Strongly Agree to 4 = Strongly Disagree, with a lower score reflecting a more favorable endorsement (summary data in Table 3). Summaries of the assessment data and student comments were provided to the activity facilitators. At the beginning and end of each scholar’s participation in the program, the scholars completed a survey that assessed program design. Statistical analyses were conducted in SigmaPlot and SPSS. Because no differences were present as a function of gender, FG status, race or ethnicity, or academic major, findings reflect the perceptions of the group of scholars as a whole.
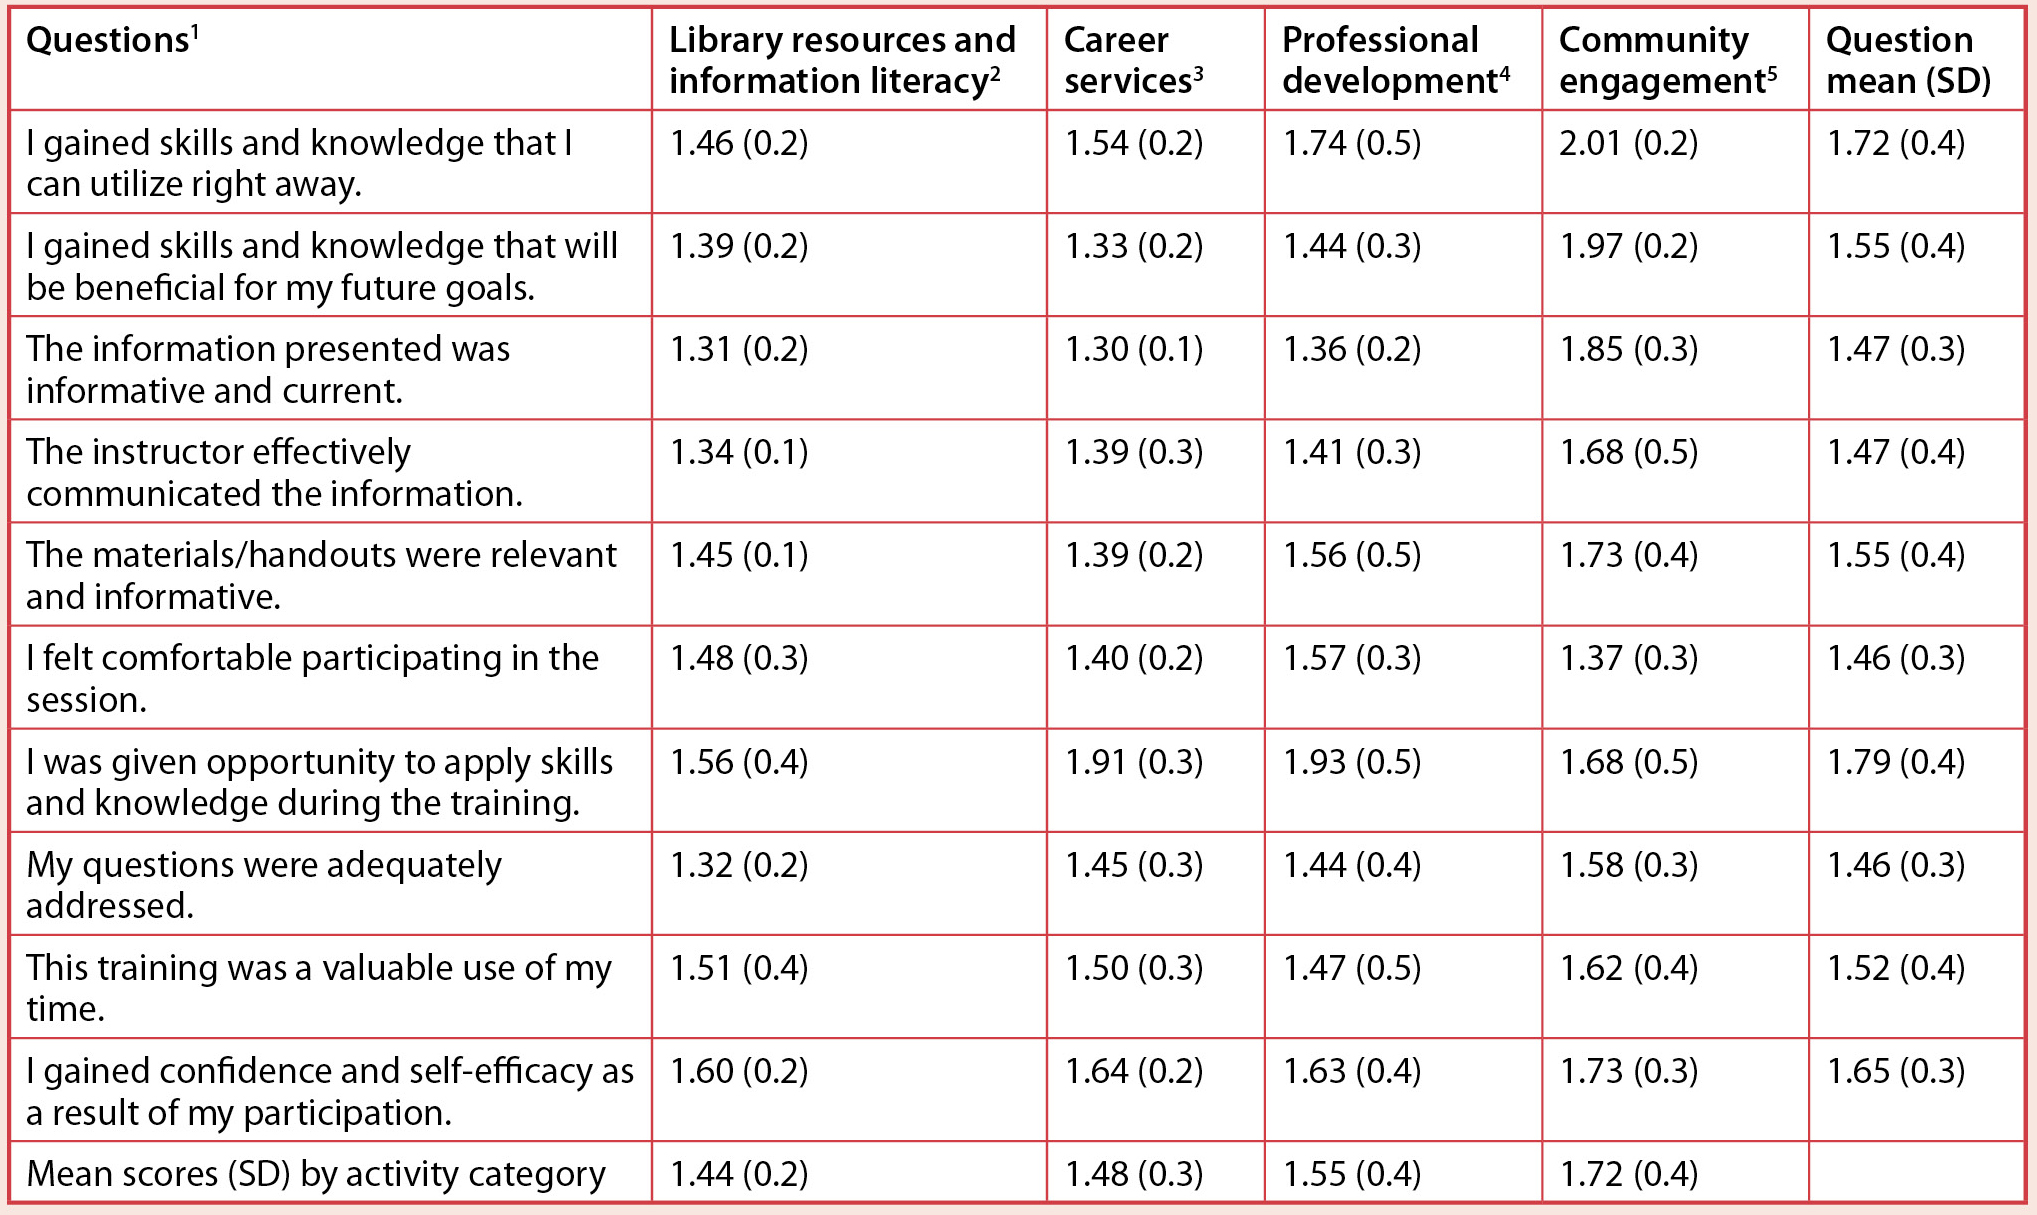
Mean score for each category of event, averaged across events and cohorts.
1The scale was: 1 = Strongly Agree, 2 = Agree, 3 = Disagree, 4 = Strongly Disagree. Assessments were administered immediately after the events.
2Mean (SD) of scores across five events, with a mean of nine surveys per event (range, 8 or 9 surveys per event).
3Mean (SD) of scores across seven events, with a mean of seven surveys per event (range, 3–12 surveys per event).
4Mean (SD) of scores across nine events, with a mean of 10 surveys per event (range, 3–15 surveys per event).
5Mean (SD) of scores across eight events, with a mean of nine surveys per event (range, 5–13 surveys per event).
Library resources and information literacy
Academic libraries promote student success through the maintenance of resources and trainings. First-generation and underrepresented minority (URM) students tend to underutilize library resources, partly because they may find the library personnel unapproachable (Brinkman et al., 2013; Zhong & Alexander, 2007). Our STEM librarian designed a workshop to orient students to library resources; the workshop was more multidisciplinary than any workshop previously offered. The workshop emphasized information literacy because new pedagogical approaches that emphasize active learning require students to access information that is disseminated through unfiltered sources (American Library Association, 2000), which may be particularly challenging for FG or URM students (Hill et al., 2013).
The workshop was administered by the STEM librarian at the beginning of the first year for each cohort; it was the most-altered activity over the grant period. During the first 3 years, the workshop focused on library resources and a citation-management program. As assessments indicated that the tour and program training were unnecessary, the final two workshops focused on information literacy. The ratings do not differ between the two designs (Table 3), but comments indicated a preference for the latter. The revised workshop addressed tools used to find scholarly products and the reliability of those search tools, with examples across STEM disciplines. They also explored the ideas of scholarship as an active conversation and scholarly authority as a context-dependent identity. The final workshop was very highly rated and elicited comments including “I didn’t know I needed to know this information” and “This should be a mandatory class . . . for anyone planning on conducting research.”
Career services
Students from underrepresented populations are less likely to exhibit confidence in their career choices and pathways (Tate et al., 2015; Harlow & Bowman, 2016) and use support services (Falconer & Hays, 2006). Our scholars attended one career services workshop per year. The first-year workshop addressed internship opportunities, résumé building, and online programs for job postings across disciplines. The second-year workshop addressed interview skills, salary negotiation, professional etiquette, and résumé review. Assessment scores did not differ between the workshop types (summary data in Table 3). Most scholars stated that this was their first interaction with career services staff.
Career services was the program component that had the greatest impact on the faculty. The S-STEM program requires grant-supported faculty to collaborate with staff to create sustainable partnerships. Our goal was to encourage faculty from the supported majors to engage with student support services to the same degree as occurred in the computer science (CS) and engineering (Eng) programs, where career services engagement contributes to professional accreditation. To that end, starting in academic year 2015–2016 (after Year 1 assessments), grant team members repeatedly promoted the workshops during biology department faculty meetings. Two members of the grant team were in the biology department, one was in chemistry, and one in geology; repeated discussions of the workshops occurred only in the biology department meetings. During the grant period, the college leadership increased engagement with career services by moving the CSTEM advisor into the dean’s suite on a half-time basis and having the CSTEM advisor attend meetings of chairs and directors. Table 4 presents the number of classroom visits per year by career services staff for the three grant-supported departments and two additional departments. While the total number of classroom visits did not change, the proportion of visits to computer sciences or engineering programs declined, while visits increased for biology classes. The eight biology faculty who scheduled visits during the grant period (one from the S-STEM team) were evenly split between untenured and tenured faculty, and the courses visited were at all levels of the curriculum. These results suggest that the repeated discussion during biology meetings created an environment in which faculty felt they could (and should) allocate class time to a career services–led workshop.
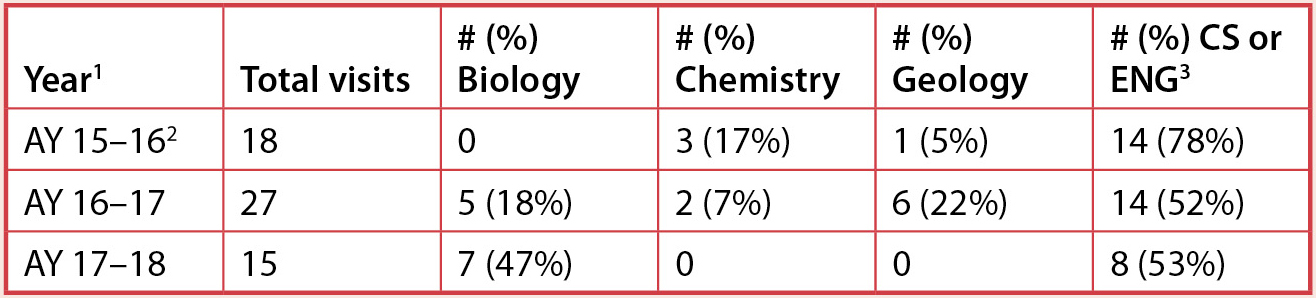
Distribution of classroom visits by career services staff to five departments.
1Years 1 (Academic Year [AY] 2014–2015) and 5 (AY 2018–2019) of the program are not included because discussions did not occur in biology faculty meetings before Year 1 assessments were done and because the program ended partway through Year 5.
2The only biology-related interactions of any sort were the S-STEM workshops.
3CS = Computer Science, ENG = Engineering; neither program was supported by the S-STEM program.
Professional development
In Year 1, we took two field trips; one was interdisciplinary. Although the scholars enjoyed both trips, in Year 2 we chose to hold only on-campus events open to all. The two on-campus events per year were seminars, employer panels, or career fairs; most were followed by social hours. The events that occurred during department seminar times were the best attended, attracting more than 90 people. Because these events were attended by undergraduate and graduate students, faculty, staff, and administrators, and because the employers were encouraged to discuss their own career pathways and hiring practices, the overall understanding of the public and private sectors increased considerably across all departments. Half of the events were interdisciplinary. Scholars were required to attend all events that did not conflict with course or work commitments, regardless of whether their career interests were represented. The multidisciplinary activities were more favorably assessed by the scholars, with means of 1.29 ± 0.1 across the 10 assessment questions versus 1.63 ± 0.3 for single-discipline events (paired t-test, p < .001).
It quickly became apparent that the same messages were articulated by seemingly distinct employers. Feedback from the scholars and other students who attended echoed the findings reported by nationwide reviews (e.g., Hart Research Associates, 2013, 2015); students (and faculty) learned that cross-disciplinary skills such as communication, problem-solving, willingness to learn, and attention to detail are the keys to success in every type of job. Scores for questions related to whether the scholars gained skills and knowledge and whether the events were valuable improved over time for the single-discipline activities as the grant team learned to articulate to the scholars that what they were about to learn from an individual employer applied to all disciplines.
As was true for career services, the professional development portion addressed an inequity in the college: students enrolled in (professionally accredited) computer sciences and engineering programs enjoyed continuous contact with regional employers. In the other half of the college, the life and physical sciences, relatively few faculty had worked outside the academy, and contacts with regional employers were rare and typically the “property” of a faculty member. The grant team found that initiating contact with employers was facilitated by using the grant as an excuse; without exception, employers were enthusiastic about a program addressing the workforce competitiveness of underrepresented students in STEM. Partnership maintenance was managed with career services staff. We created more than a dozen partnerships with nonprofit organizations; state, federal, and tribal agencies; and corporations, eight of whom have hired S-STEM scholars (three after the scholar and employer met at an S-STEM event).
Community engagement
For most of these activities, we partnered with the Communities in Schools (CIS) program, which supports K–12 students who are at risk of dropping out of school. Our institution provides year-long mentorship opportunities to undergraduate students (CSTEM students rarely participate) who visit the local middle or high school once per week. Our scholars worked with the CIS program twice per year for most grant years. In winter, the scholars visited the schools and ran a multidisciplinary lesson plan. In spring, the children and their mentors walked to campus for an afternoon of STEM activities. This activity allowed faculty from all departments to participate in outreach, assisted by the scholars. The children rotated through four 40-minute activities; most were based on standard laboratory activities using classroom equipment. CIS staff conducted informal polling each year, which was used to select participating departments and faculty for the next year. The on-campus visit was a successful capacity-building initiative, and per the request of CIS staff, it has continued after the grant ended, with funding from CSTEM administration and the Office of Community Engagement.
During the first year, the scholars only completed the school visit and their second event involved volunteering for a national conference hosted by our institution. We had anticipated that this experience would help the scholars learn how conferences are run and provide them the opportunity to network with other scientists. Assessments indicated a strong preference for the after-school outreach activity over the conference involvement activity (means across the 10 questions: outreach = 1.38 ± 0.3; conference = 2.21 ± 0.3; paired t-test, p < .0001). We therefore focused on the CIS partnership and developed the on-campus activity starting in Year 2. This preference is consistent with evidence that outreach activities involving at-risk youth are beneficial for underrepresented STEM students, as the activities tend to increase student self-efficacy, sense of community, and understanding of how STEM benefits society (Clewell et al., 2005; NAS, 2011).
Assessment and survey results
We first considered whether the activity categories differed across the 10 assessment questions by reviewing the mean score for each question across the five to nine events per category (Table 3). Across the 10 questions, the community engagement activities were rated more poorly than the information literacy workshop and career services workshops (Friedman repeated measures ANOVA with Tukey multiple comparisons, overall p = .008). We next compared the individual event scores averaged across participants. The community engagement events were rated as contributing less to gains of immediate skills or knowledge (Question 1, Kruskal-Wallis one-way ANOVA with Dunn’s test post-hoc comparisons, p = .016) than the information literacy workshop and less gain in long-term skills or knowledge than all three other activities (Question 2, Kruskal-Wallis ANOVA, p = .002). Similarly, the information presented during community engagement events was considered to be less informative and current than in the other three workshop types (one-way ANOVA with Holm-Sidak test, p < .001). The activity types did not differ significantly in any of the remaining questions (Kruskal-Wallis or one-way ANOVA, p ≥ .314). These results suggest that the scholars did not recognize that the community engagement events could help them develop interpersonal skills. This partly reflects differences in program management across the activity types. As noted above, the faculty team learned to articulate to the scholars the value of attending single-employer professional development events; community engagement events tended to be discussed as fun opportunities to share science with the community.
To facilitate direct comparisons of activity types, we used the same survey instruments for the four activity categories. While this approach simplified data coding and statistical analyses, one consequence was that some statements—such as “The materials/handouts were relevant and informative” and “My questions were adequately addressed” —were less applicable for some events (community engagement) than for others (information literacy). The survey instrument was developed at the beginning of the project, immediately before the first of several workshop-based activities. If we were to repeat this type of grant-sponsored program and wanted to compare scholar experiences across a range of activity types, we would continue to use a single survey instrument but likely would replace questions that are only suitable for workshops with those that emphasize scholar experience more than activity design, such as “Would you recommend this activity to your peers?” and “Would you attend this event if it was not required?”
Initial program surveys were administered in the first few weeks for each cohort, after the program components had been explained to the scholars but before activities began. The exit program surveys were administered shortly before the students completed their last term. Both surveys included the following open-ended prompt, with up to three answers allowed: “What attracted you to this program?” The exit survey also asked, “What did you get out of this program?” As noted in Table 5, the scholars placed a high value on the financial support, but that was less important as they reflected back on the program. In the exit surveys, the scholars indicated the value of the career and graduate school preparation, community outreach opportunities, and faculty mentoring. There were no changes in the proportion of scholars who valued the networking opportunities (nor patterns in networking with peers versus potential employer). Four of the scholars indicated that they gained confidence in themselves as a result of participating in this program.
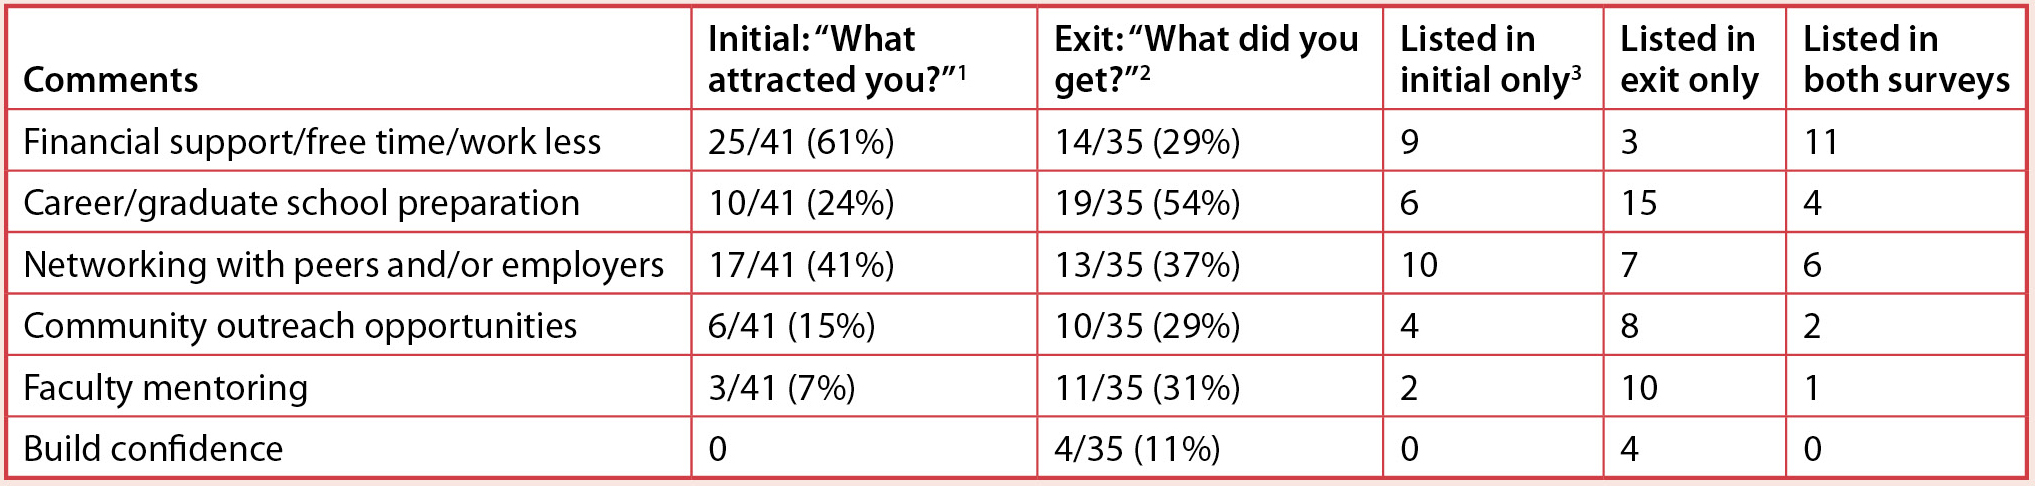
Perceived attractive and attained aspects of the S-STEM program.
1Data are not included from the fifth cohort, who were in the program for less than 1 year, or for two students who left the program prematurely because their academic major changed.
2Data are only included for the 35 scholars for whom we have both initial and exit surveys (excludes fifth cohort). Initial surveys were administered within the first few weeks of the first academic term on scholarship support; exit surveys were administered just before graduation. Approximately half of the exit surveys were from scholars in the program for only 1 year and half from scholars in the program for 2 years.
3Only counted if we had an exit survey; N = 35.
Conclusions
This grant program was an opportunity to develop sustainable cocurricular activities that increase the workforce readiness of STEM students who are enrolled in majors that do not have professional accreditations. The activities were designed to address the challenges that FG and URM students face and were intended to build multidisciplinary skills. The program required collaboration between faculty, administrators, and student support staff. We found that career services staff and STEM librarians had to alter existing workshops to make them appropriate for our interdisciplinary cohorts, ultimately creating a resource for the campus as a whole. Overall levels of faculty engagement with staff increased, but only with the career services staff and only in the department in which S-STEM activities were discussed frequently. Over the 5-year grant period, employer relations increasingly became viewed as a community effort, changing departmental culture; these employers continue to participate in on-campus activities hosted by other faculty. The most successful capacity-building activity, the on-campus visit from the children in the CIS program, engaged all departments and allowed faculty to participate in an enjoyable activity that contributed to their tenure and promotion expectations. We continue to host this on-campus CIS visit annually. Finally, we learned that, to some degree, how the scholars viewed the activities depended more on how we talked to them about the events than the scholars’ actual academic or demographic features. ■
Acknowledgments
This material is based on work supported by the National Science Foundation under Grant No. DUE-1356204. Co-principal investigators on the grant were Rebecca Brown, Nicholas Burgis, and Carmen Nezat. We thank the following partners: CH2M Hill, Communities in Schools, GenPrime, GeoEngineers, Idaho Department of Environmental Quality, Jubilant HollisterStier, Kalispel Tribe of Indians, The Lands Council, Paw Print Genetics, Spokane County Environmental Services, Tainio Biologicals, Inc., Terraqua Environmental Consulting, Turnbull National Wildlife Refuge, U.S. Fish and Wildlife Service, and Washington State Department of Ecology.
Joanna Joyner-Matos (jmatos@ewu.edu) is a professor in the Department of Biology and Kayleen Islam-Zwart is a professor in the School of Psychology, both at Eastern Washington University in Cheney, Washington.
Equity Inclusion Teaching Strategies Postsecondary