![]()
![]()
Brief
Heat Maps as a Fun and Instructive Way to Gauge Student Perceptions on Skill Development

Capturing student perspectives and growth in a quick, engaging way has long been a goal for many STEM educators. The STEM program, Systems Education Experiences (SEE), works directly with high school students and teachers in informal settings that feed into curriculum development for formal classrooms (Baliga Lab 2023; Day et al. 2021; Orellana et al. 2020; Ludwig et al. 2015; Ludwig and Baliga 2008). In this Brief, we share a fun, effective way of quickly gathering student perspectives on skill development over days, weeks, or months. This technique was first developed and tested in our online informal high school program, and is now being used in classrooms across 12 states (with the highest use respectively in Washington State, California, New Jersey, Oregon, Maryland, Texas, and Iowa) and eight countries.
SEE is a student-teacher-scientist partnership program that provides internships, ambassadorships, and courses for high school students and teachers. During these programs, participants complete authentic research and translate their projects into curriculum modules. These modules are field tested in formal classrooms and are then widely and freely disseminated via teacher professional development, the SEE website, and through online Open Educational Resource (OER) hubs (Baliga Lab 2023). SEE modules are used in all 50 states, are NGSS-aligned, and have been adopted by California as part of their recommended three-course framework (Orellana 2020; California Department of Education 2016).
The Need
At the start of the pandemic, SEE’s informal high school programs were delivered online. As a result, we accepted more people into our programs because space and geographic location no longer limited enrollment. We endeavored to keep programming effective and engaging with innovative pedagogy and authentic STEM content and skills despite the fourfold increase in student participants. In this new online setting, we especially needed to revamp student assessments to make them quickly visual for educators leading courses and to ensure we were helping students learn applicable STEM skills such as data literacy and visualization.
How We Met the Need
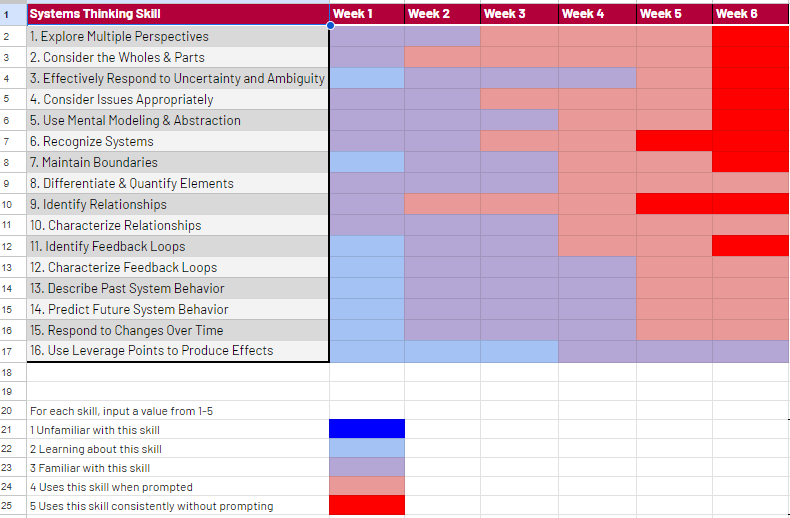
We accomplished this by creating heat maps for students to use to gauge, track, and communicate their perceptions on their skill development over multiple weeks. A heat map is a tool commonly used by scientists, and many other professionals, who want to visualize data of varying magnitude by color. We started by creating a heat map template in Google Sheets and Excel based on general skills that are applicable to all of our programming—systems thinking skills. We listed each of the 16 skills (Arnold and Wade 2017) in rows within one column. Then we added a time component across the top, in one-week increments, which made sense for our programming. We added both a legend and clear student instructions directly onto the sheet. We added conditional formatting to the cells so that students could rank themselves with a number (1–5) for each skill, each week. We also added a column that prompted students to describe the activities they completed that led to growth/learning in that skill area. Please see Figure 1 for a high school student’s modified heat map as an example and Figure 2 for a compiled example that displays data from 41 students.
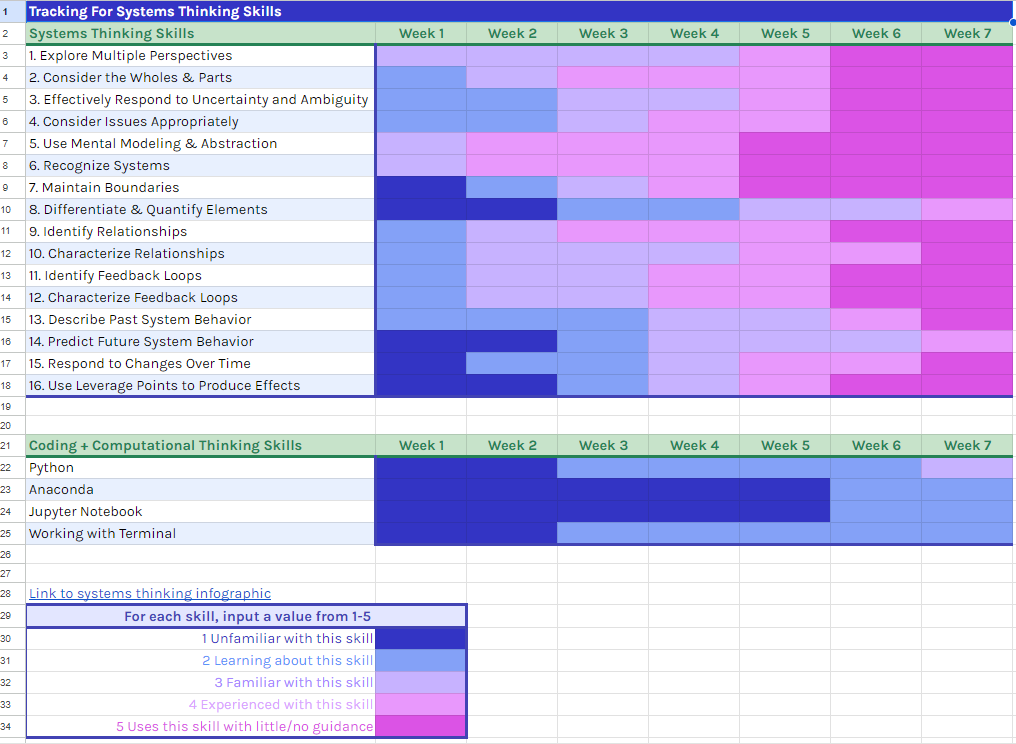
To prepare students to use this tool, we completed several activities that allowed students to learn about each of the 16 systems thinking skills. These activities also helped them consider when, where, and how STEM professionals use these skills. They did this individually and as a group through hands-on activities and discussions with educators, scientists, and other STEM professionals. We then gave the students a quick demonstration of how to use and copy the template heat map so they would have their own version. Students were encouraged to use their heat map to deeply consider how they would rank themselves, at this point in their academic career, against their future selves, who use these skills independently and regularly as a habit. At the beginning this was completed for their own benefit and shared only with the teacher. As the days and weeks progressed, discussions about confidence in certain areas were facilitated in small and then larger group discussions and share-outs.
Students really enjoyed their heat map tracking and ran with it. After learning about the conditional formatting, they altered the colors to suit their own style and took ownership in their next steps as a learner and leader. They saw where their strengths and weaknesses were and connected that to the work they did during the course. The “activity description” column allowed both students and educators to see which activity seemed to result in the most growth for students and to comment on potential next steps to continue growing in that area. Students sometimes rated themselves highly on one skill, but then noticed after an activity that they were not as confident in their ability as they had previously been. Then a plan could be devised to do more in that area to improve.
The template format allowed us to quickly compile a set of heat maps to capture collectively how the group felt their skills were developing. The students’ descriptions, the individual self-ratings, and the compiled group ratings led to optimized programming both in real time and for future cohorts. Through open conversations with the students, we added new activities, removed upcoming activities that were not likely needed, or expanded time in certain areas based on patterns we saw in students’ heat map rankings and comments.
Expanding Use
This worked well as an educational activity that taught students about heat maps as a way of visualizing data. It also worked well as a meta-cognitive way of discussing how the lessons and activities were leading to skill development over time. Thus, we incorporated this into a module for high school formal classrooms. Through field testing, we have found that it works well in person, online, and with a variety of skills and/or learning targets. The template and instructions are located within our Systems Are Everywhere module as part of Lesson 2 (Howsmon 2021). Since we began this in 2020, we have optimized this technique with over 300 high school students and have shared it with hundreds of teachers and community college instructors through professional development workshops.
Conclusion
Guiding students through using heat maps as a data visualization tool—and as a way to track and reflect on their own skill development—is a meaningful educational activity. This activity led to a high amount of engagement, elevated student voice, and gave students a way of seeing how their input led to pedagogical shifts. There is potential for expanding this activity into a more rigorous assessment to be used in both high school and community college courses. Because this is highly adaptable and engaging, we encourage you to use our template or create your own for use in your setting!
Claudia McLaughlin Ludwig, M.Ed., NBCT, is Director of Systems Education Experiences in the Baliga Lab at the Institute for Systems Biology in Seattle, Washington. Her expertise includes bridging the distance between professional STEM research and classrooms while broadening participation in STEM.
Acknowledgment
Thank you Rachel Calder (of Institute for Systems Biology (ISB) and OMNY Health) who used her data analysis skills to create and launch the first heat map template. Thank you to teacher Elizabeth Rider (North Kitsap High School Poulsbo, Washington) for helping launch this online in 2020 with 42 students in our first round of testing. Thank you Dr. Becky Howsmon (Ballard High School in Seattle, Washington) and Barbara Steffens (ISB) for helping to build this assessment into our curriculum module Systems are Everywhere and to the entire team of students and teachers for creating the module (see the reference below). Thank you also to Dr. Becky Howsmon, Dr. Jennifer Eklund, and Caroline Kiehle (ISB) who shared this assessment with hundreds of teachers and broadened its use to formal high school classrooms and community colleges. Thank you to Miranda Johnson and Sara Calder, AmeriCorps fellows who use it with students in our informal programming currently and shared it at the 2023 NSTA conference in Atlanta, Georgia. And thank you especially to Dr. Nitin S. Baliga for founding this program within his systems biology lab group. Since 2003 his leadership and support have enabled the translation of STEM content and skills into hands-on learning for millions of students. This work was funded by the Boeing Foundation and by the National Science Foundation (DBI-1565166 & 2042948).
Assessment Computer Science Science and Engineering Practices Teaching Strategies High School Informal Education