![]()
![]()
feature
The Carbon Cycle and Climate Change
Using an active, problem-based approach to understand the carbon cycle and climate change

Environmental education for all students is becoming more urgent as societies strive to deal with challenges such as climate change and loss of biodiversity. Teachers have an important role to play in defining the environmental knowledge, beliefs, and actions of the next generation. Differing from general science education, environmental education includes the goals of increasing student knowledge about the environment and promoting pro-environmental behaviors.
Understanding the anthropogenic inputs responsible for alteration of the global carbon cycle is essential if we are to graduate environmentally literate citizens. The association between anthropogenic inputs of carbon into the atmosphere and climate change is best understood if students first have a solid understanding of the carbon cycle. In this three-part activity, students will research and diagram the carbon cycle, provide each other with constructive peer feedback, and then work as a group to apply this new knowledge to create a presentation focused on community solutions to climate change.
Carbon is the most important element to all life on Earth. Making up an average of 20 percent of total body weight, it is part of cell membranes and walls, forms part of essential proteins, and stores energy for later use (Friedland, Relyea, and Courard-Hauri 2011). Along with its role in living organisms, carbon is also found stored in rocks, sediments, soils, the ocean, and the atmosphere. These are the reservoirs that carbon cycles through as it moves, sometimes quickly and sometimes more slowly, among the biotic and abiotic elements of the Earth.
The primary mechanisms involved in the movement of carbon from one reservoir to another are photosynthesis, respiration, sedimentation and burial, extraction, combustion, and exchange of carbon between the atmosphere and oceans. One of the faster processes in which carbon moves between reservoirs occurs in the food chain, where plants remove carbon from the atmosphere in the form of carbon dioxide and combine it with water to create sugars. As animals consume plants, they digest the sugar molecules, and respiration, excretion, and decomposition return the carbon to the atmosphere or soil. Longer-term storage of carbon is found in the oceans, as well as in rocks and fossil fuels that are buried deep beneath the Earth.
Human activities—such as extracting fossil fuels and burning them, breaking down carboniferous rocks (such as limestone for the production of cement), and deforestation—have an enormous impact on the global carbon cycle. As a result, global atmospheric levels of carbon dioxide have been rising since the beginning of the Industrial Revolution (see “On the web”). Student understanding of climate change and the human role in the alteration of the atmosphere is greatly facilitated by knowledge of the carbon cycle.
The activities described in this article use active, collaborative, inquiry-based learning techniques to engage students in developing a model of the carbon cycle and developing
community-based solutions to the problem. Inquiry provides a pathway by which students can become more engaged learners, actively seeking answers (Barrow 2006). Data has shown that inquiry-based teaching has a significant positive effect on student learning and that engaging students in generating, developing, and justifying explanations as part of other science activities is an important element to help students learn science (Furtak et al. 2012).
Further evidence suggests that teacher-led inquiry lessons have a larger effect on student learning than those that are entirely student-led or those that are taught using traditional methods, such as lecture (Furtak et al. 2012).
Instructional plan
The lesson begins with a three-minute TedEd video titled “Climate Change, Earth’s Giant Game of Tetris,” which connects the carbon cycle to climate change and describes several ways that human impacts are responsible for increased planetary warming (see “On the web”). The TedEd website also has five multiple-choice and three short-answer questions to get students thinking about the carbon cycle, climate change, and human impact.
The teacher can then provide the students with a framework for their research by instructing the students to think of the carbon cycle in terms of carbon reservoirs (areas that absorb and store carbon for long periods) and carbon fluxes (the mechanisms that move carbon between reservoirs, such as photosynthesis and cellular respiration).
The students will work in groups of four or five. Teachers should use their knowledge of their own student’s abilities in the creation of groups and provide scaffolding accordingly. English Language Learners (ELLs) and students with Individualized Education Programs (IEPs) will benefit from vocabulary lists or notes provided by the teacher. The activity requires the following supplies:
- Portable computers with internet access
- Chart paper and markers
- Sticky notes
Part I: Carbon cycle
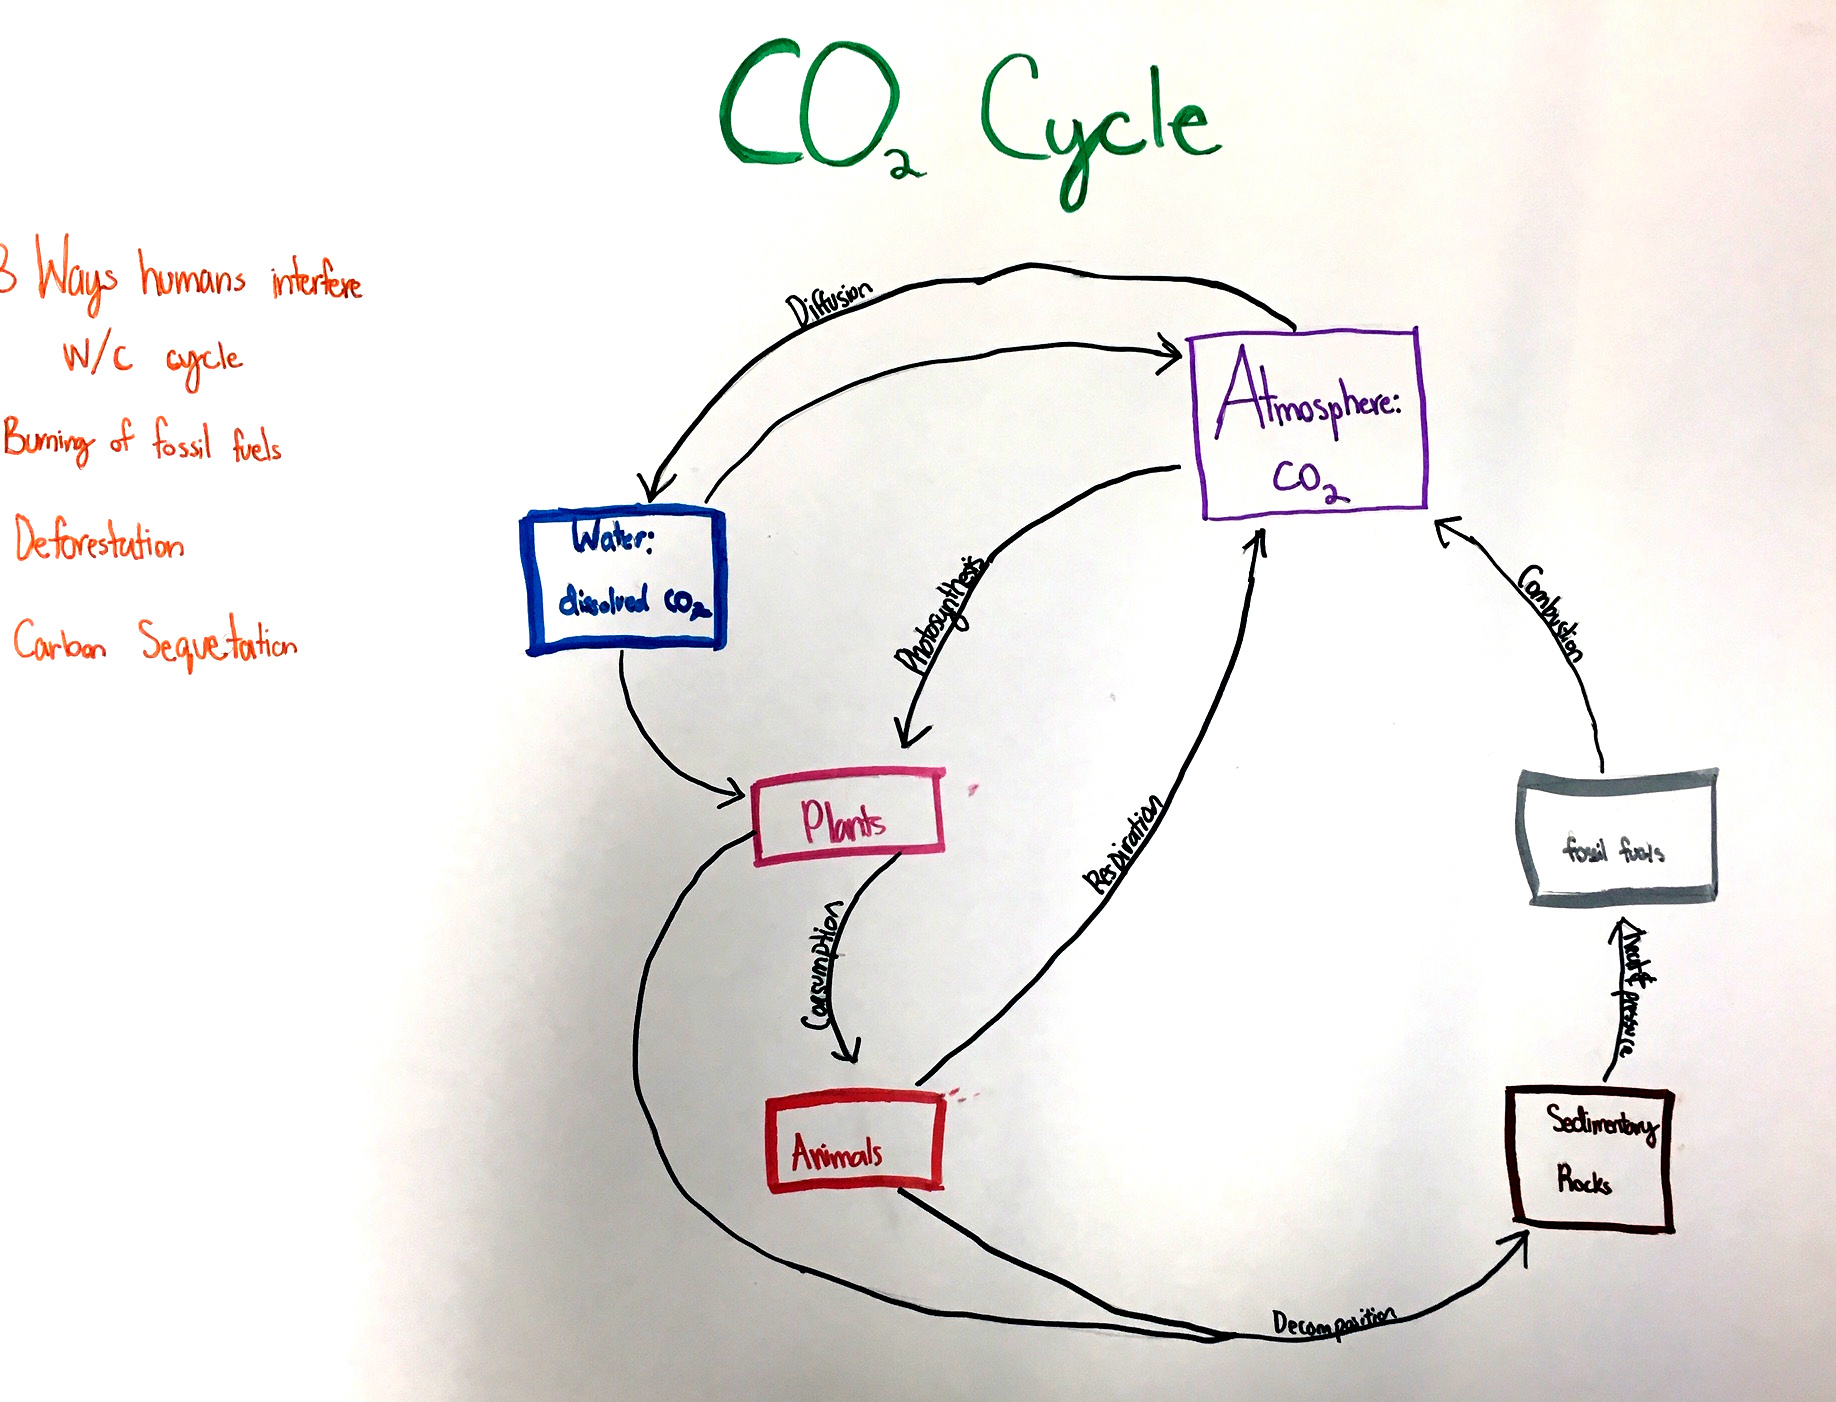
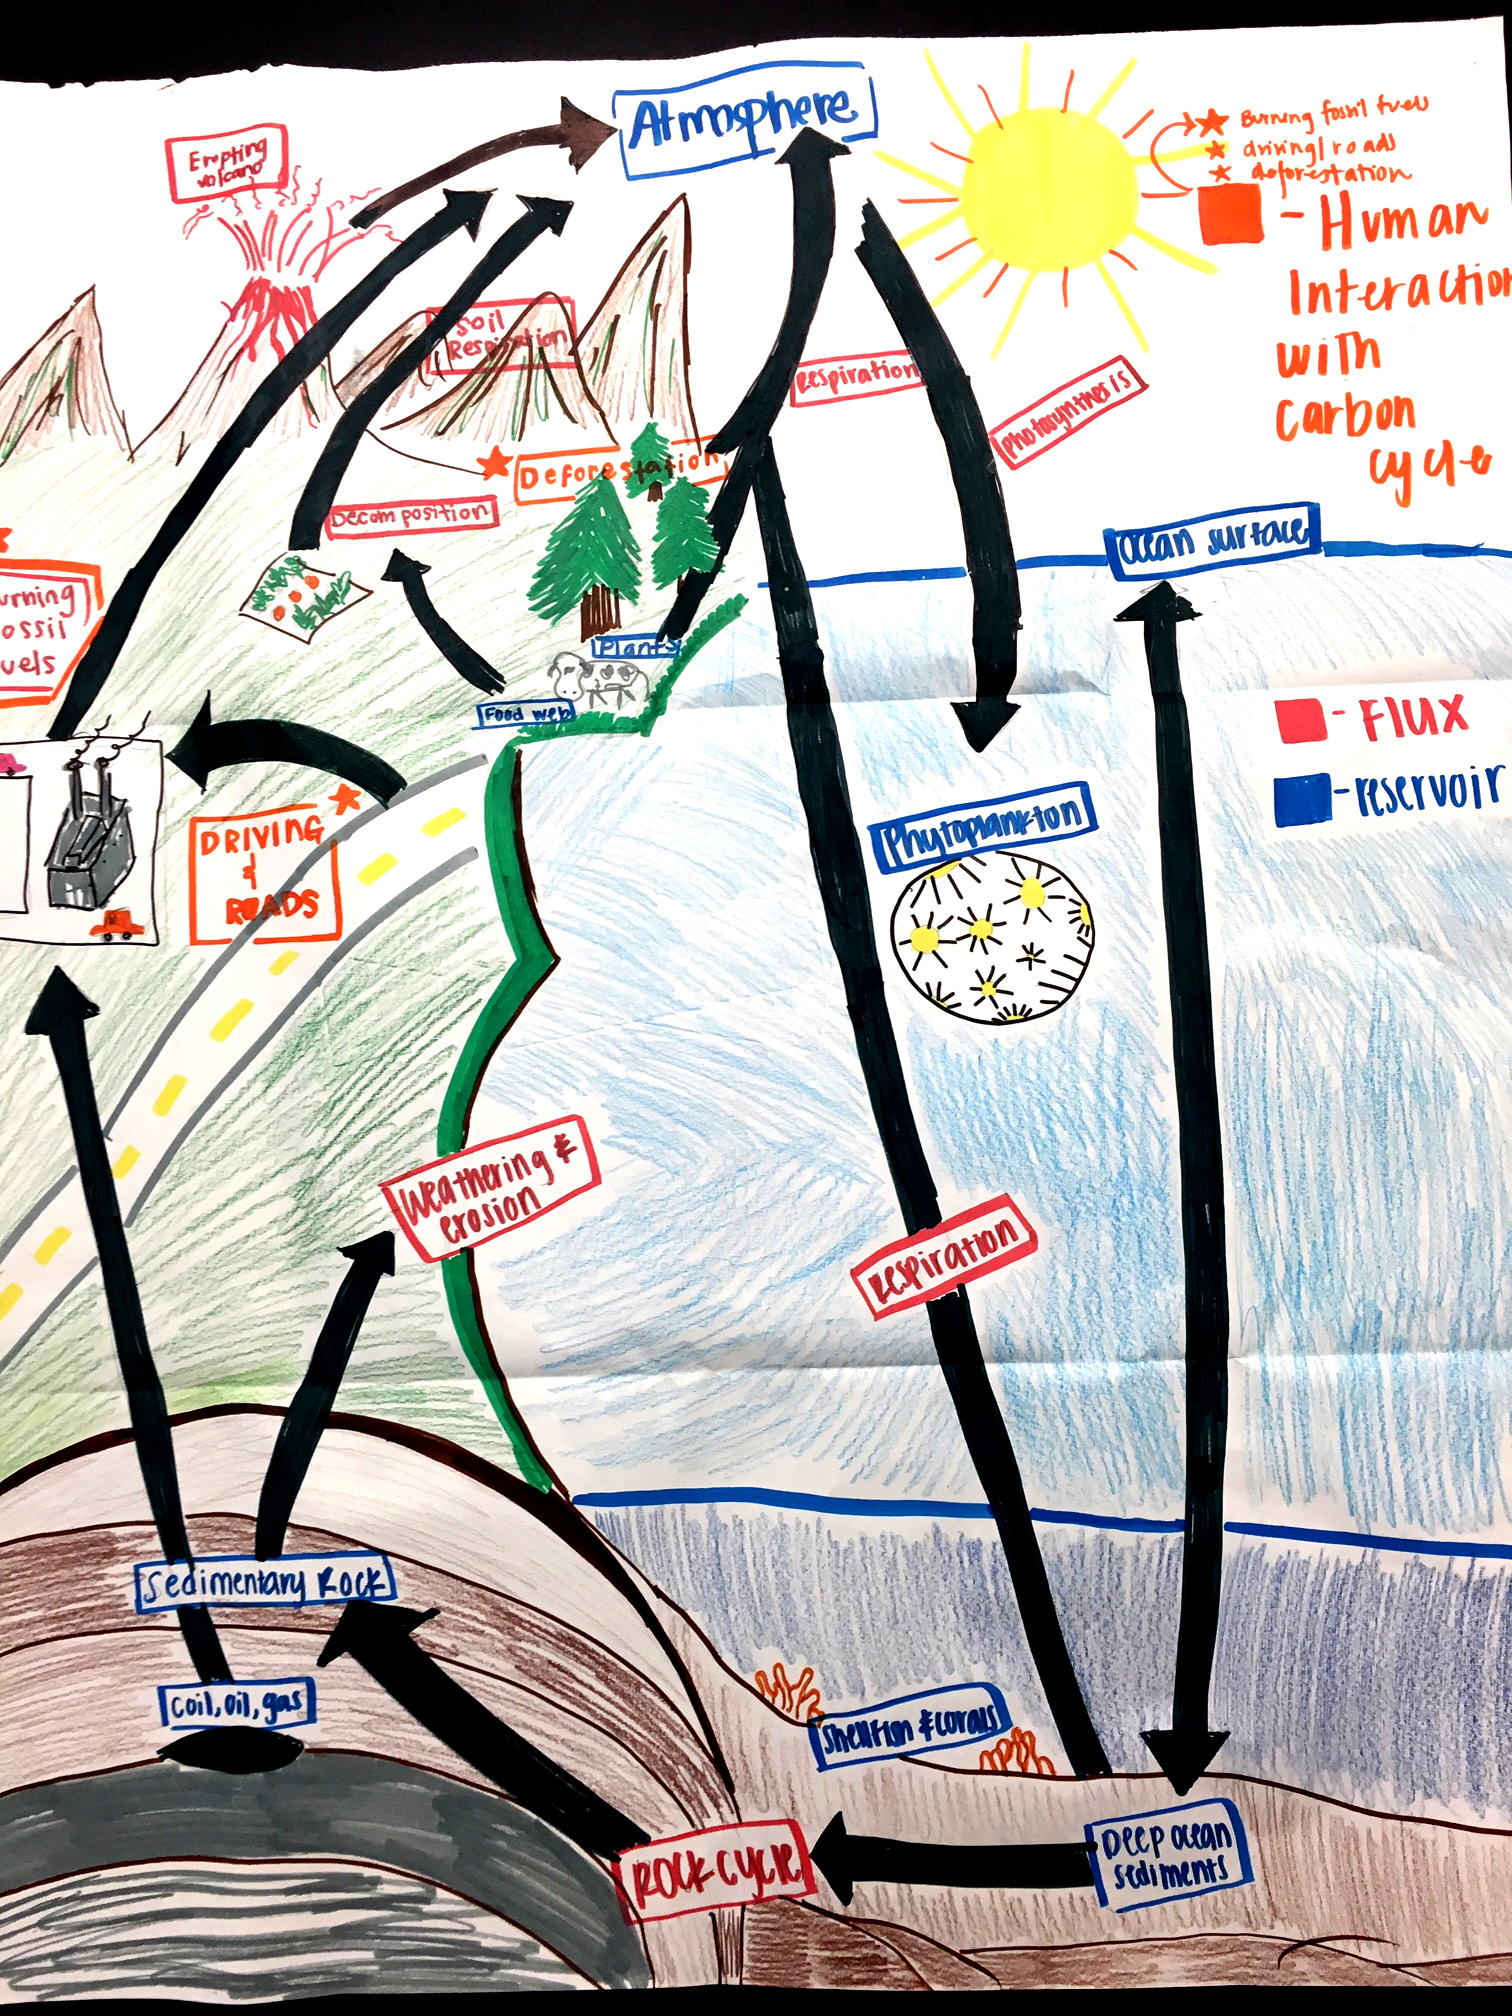
Although the students have been instructed to define the carbon cycle in terms of carbon reservoirs and carbon fluxes, they have not been provided with a list of reservoirs. The student groups will create their own research plans, use the internet to find the information, and create a diagram of the carbon cycle on the provided chart paper. Instruct the groups to find at least six carbon reservoirs and the fluxes between them, and suggest the use of box-and-arrow diagrams.
Creation of the carbon cycle model allows students an opportunity to develop a model based on evidence to illustrate the relationships between components of a system, satisfying this dimension of the Next Generation Science Standards (NGSS) science and engineering practices. The NGSS disciplinary core idea, that changes in the atmosphere due to human activity have increased carbon dioxide concentrations and thus affect climate, is addressed as students are also instructed to find at least three ways that humans interfere in the carbon cycle. These should be listed separately on the bottom or the back of the chart paper that they will use to draw their cycle. After this initial instruction, the teacher’s role is that of a facilitator, walking from group to group, providing necessary supplies and minimal guidance.
Examples of completed student carbon cycles are found in Figures 1 and 2.
Part 2: Peer feedback
As the student groups complete their carbon cycle diagrams, they are instructed to display them around the room. When all are complete, the students participate in a gallery walk to provide feedback among the groups and to solidify student understanding of the carbon cycle. Gallery walks are an excellent way to expose student misconceptions and give students the opportunity to use scientific language, rather than simply hearing it from an instructor during a lecture (Francek 2006).
The gallery walk
Prior to the activity, the teacher should provide an explanation for the purpose of the activity, such as “discussion with other groups will help to make everyone’s carbon cycle better and more accurate.”
Split the student groups in half. Two students from each group will “walk the gallery” while the other two remain with the group’s carbon cycle chart to participate in discussion with others during the activity. Students for whom English is a second language (ELLs) should be supported by pairing with native English speakers for the gallery walk.
Explain the procedure to the students. The student pairs will visit the other stations, look at their carbon cycle charts, and discuss the differences from their own chart, as well as differences in reservoirs or mechanisms for the movement of carbon. Every five minutes the student pairs move to the next group.
Provide each group with sticky notes and the Gallery Walk Discussion Worksheet (Figure 3). As they move from group to group, they should use the sticky notes to record their feedback for each group’s carbon cycle and stick it on the chart paper at that station. Groups that follow should not duplicate the same ideas. Encourage students to engage in discussion and to note the similarities and differences in the reservoirs and fluxes that other students have included in their carbon cycle models. The students should also be encouraged to compare modes of human interference in the cycle with each group and perhaps add some to their own list. The gallery walk discussion worksheet is used to record this type of new information or ideas that they would like to add to their own carbon cycle pictures.
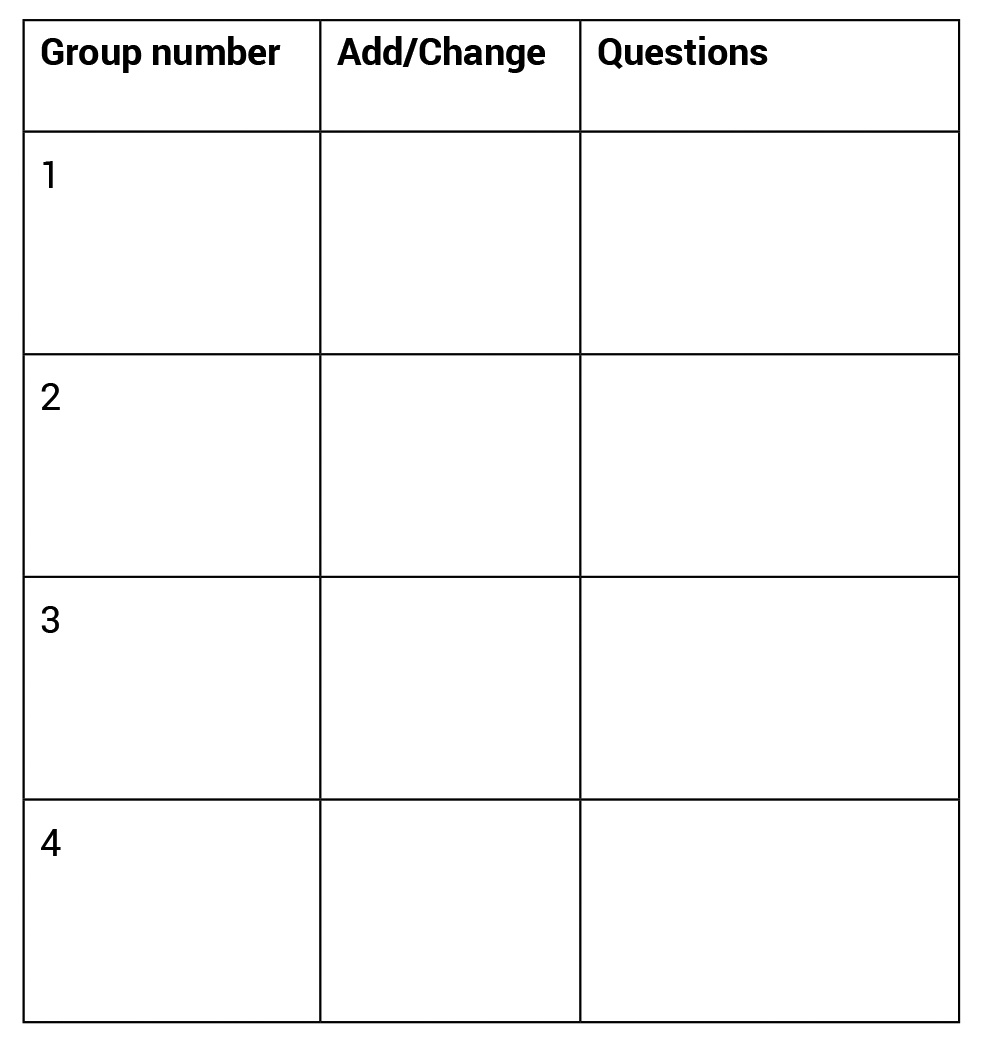
Gallery Walk Discussion Worksheet.
1. Record the group number
2. Record notes on things you would like to add or change about your own carbon cycle based on your discussion
3. Record any questions you have based on your discussion
When each of the pairs has visited all of the other stations, the students will switch with the others in their group and stay with the group carbon cycle poster while the other groups walk the gallery. This way, all students get an opportunity for this important feedback and interaction.
Once all students have completed their walk, they should return to their original group. Using the sticky notes provided by other students and the notes they took on their own discussion worksheet, they should work as a group to improve their carbon cycle.
Part 3: Carbon in our town
Students are asked to apply their new knowledge of the carbon cycle and anthropogenic inputs that interfere with the cycle by creating a presentation suitable to present to our city council that answers the following questions:
- How can we use data to effectively lobby our community about the dangers of climate change and the changes in individual behaviors that can influence its severity?
- What can city officials do to promote citizen behaviors that will decrease our town’s total greenhouse gas output?
The students then present their ideas to the “city council” (the class), develop a plan for further research, and carry out the research. As a planning aid, the students are provided with a brainstorming worksheet (Figure 4). The groups produce a five-minute presentation (typically using video or PowerPoint) and use data to either persuade the audience as to the urgency of mitigating our community’s contribution to climate change or explain why their plan will succeed.
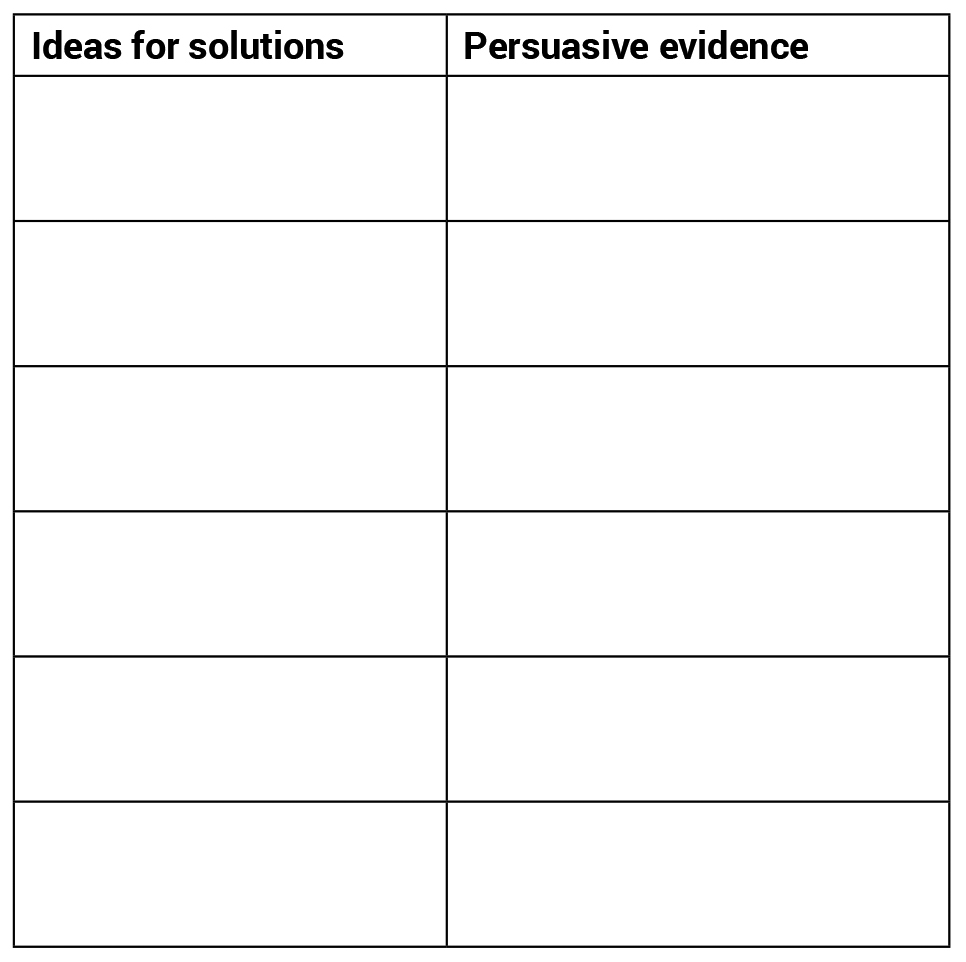
Brainstorming worksheet.
With your group, brainstorm solutions that answer the following question: How can we use data to effectively lobby our community about the dangers of climate change and the changes in individual behaviors that can influence its severity?
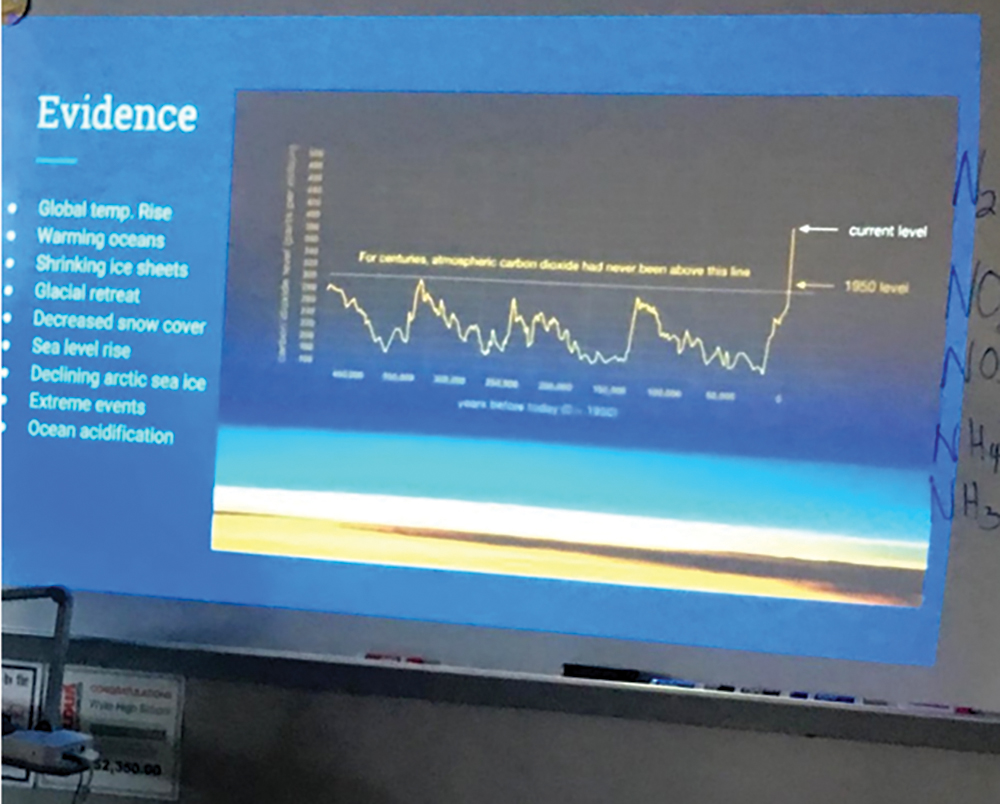
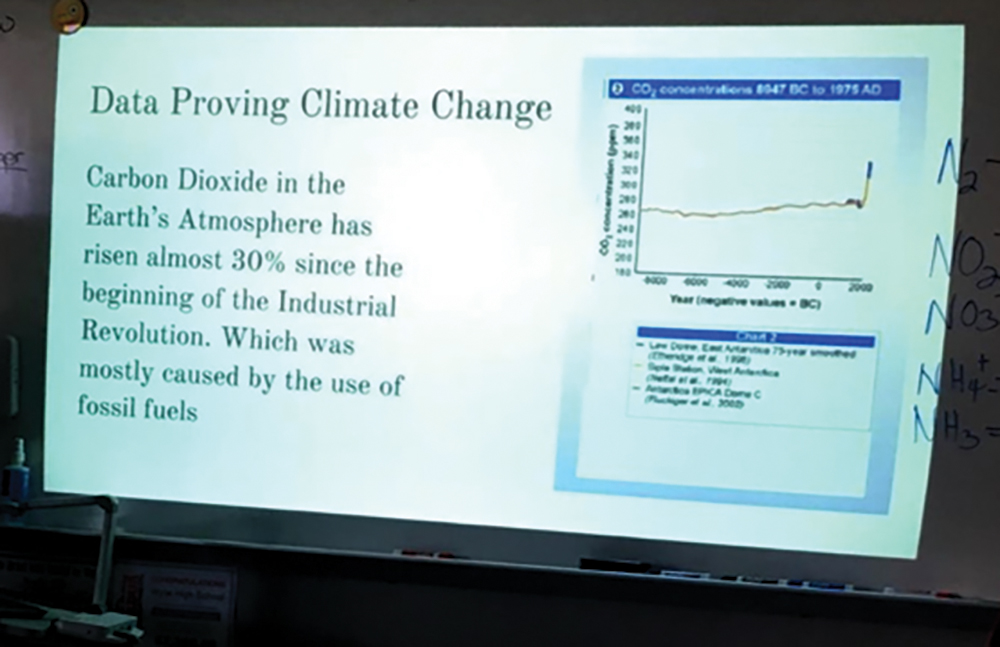
Student presentations (Figures 5 and 6), as expected, vary in their quality, creativity, and depth of thought. Students may also consult the grading rubric to help them prepare their presentations (see “On the web”). This activity has resulted in many excellent—and a few truly outstanding—presentations that contain research-based, creative, and realistic solutions capable of having a real impact on our town’s total output of greenhouse gases. Sharing the presentations in class also results in authentic student questions and productive class discussions.
Assessment
After completion of this activity, students should be able to
- Sketch a simple model of the carbon cycle, including carbon reservoirs and fluxes.
- List and describe multiple ways that humans interfere with the carbon cycle.
- Explain anthropogenic climate change.
- Describe individual, community, and global behavior changes with the potential to decrease anthropogenic inputs of greenhouse gases.
This activity lends itself to multiple assessment opportunities. First, as the students complete their carbon cycles and participate in the gallery walk, they compare their carbon cycle chart with those of others, eventually adding parts they left off or changing their own models. This is an important step, as inevitably some of the students’ initial models are incomplete or wrong. Comparison and discussion with other groups is essential to help students correct their own work. Second, the students are evaluated on their final presentation based on the rubric, which they have been given prior to presentation. Student learning from this activity is often also evaluated in a summative assessment given at the end of a larger unit that includes all of the biogeochemical cycles or other related material.
Extensions
The project can be extended into related subject areas. For mathematics, the student groups can create a quantitative cost/benefit statement based on actual data. Students should calculate the monetary expenditures necessary to implement their plan for decreasing their town’s carbon footprint and the potential savings in pounds of carbon dioxide not added to the atmosphere. For engineering, have the student groups research, design, and report on engineering solutions for schools and city buildings that result in at least a 33% decrease in the town’s overall carbon footprint.
Conclusion
The activities described in this article use active, collaborative, inquiry-based learning techniques to engage students in creating models of the carbon cycle, evaluating and discussing those models with classmates, and developing ideas for community-based solutions to the problem of anthropogenic climate change. The activity is an effective way to help students connect the carbon cycle with climate change, a connection that most do not automatically make without explicit instruction. It also provides students with opportunities to connect global climate change to local activities, as well as to acquire and practice skills such as critical thinking, creativity, collaboration, and communication.
On the web
Carbon cycle project grading rubric
TedEd video, multiple choice and short answer questions
Katherine Street Hoover (katheyhoover@yahoo.com) is a PhD Student in STEM Curriculum and Instruction at Texas Tech University and an AP environmental science and environmental systems teacher at Wylie High School in Wylie, Texas.
Climate Change Earth & Space Science Inquiry Lesson Plans Three-Dimensional Learning High School