![]()
![]()
Visualizing the Environmental Effects of Electronics
Using Infographics and Science Museum Exhibit Design to Communicate Learning

This article describes a final project and performance task for a physical science unit thematically centered on the social and environmental implications of manufacturing and disposing of electronics. For the final project in this unit, students are first asked to design and publish an infographic. Subsequently, students collaborate with their peers to create an interactive science museum exhibit about the physical and chemical processes used to manufacture electronics as well as the social and environmental consequences of the electronics industry. The design of these performance tasks are grounded in the idea that students engage more deeply with the science content itself when they are also asked to reflect on the social implications of this knowledge and their own personal decision-making.
In their article about the role of infographics in the science classroom, Polman and Gebre (2015, p. 872) write that “there is considerable recognition in the research literature that using multiple forms of representation such as infographics in science education has motivational, cognitive, and communicational benefits for learnings.” Jane Krauss (2012), writing for the International Society for Technology in Education, discusses how infographics can be used to develop students’ ability to engage in analysis and interpretation, and writes about how projects centered on infographics provide an opportunity for students to develop skills in the creativity and innovation indicators of the National Educational Technology Standards (NETS). The use of infographics in this project, combined with the public audience of the museum event, motivates students to create high-quality content.
The unit
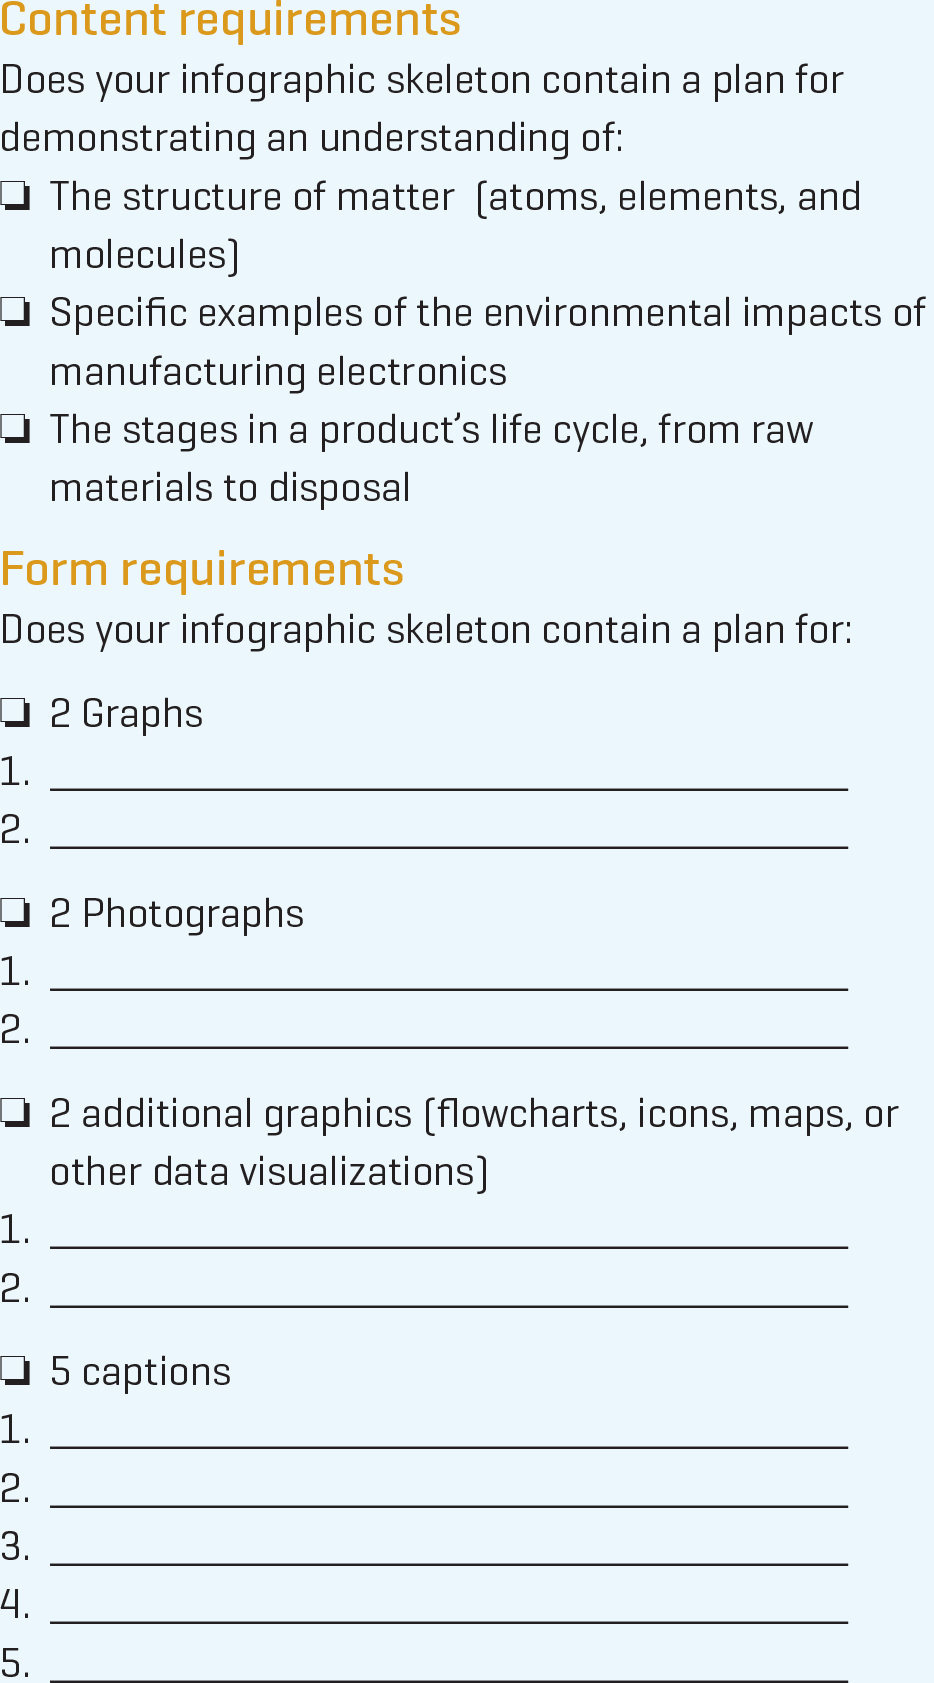
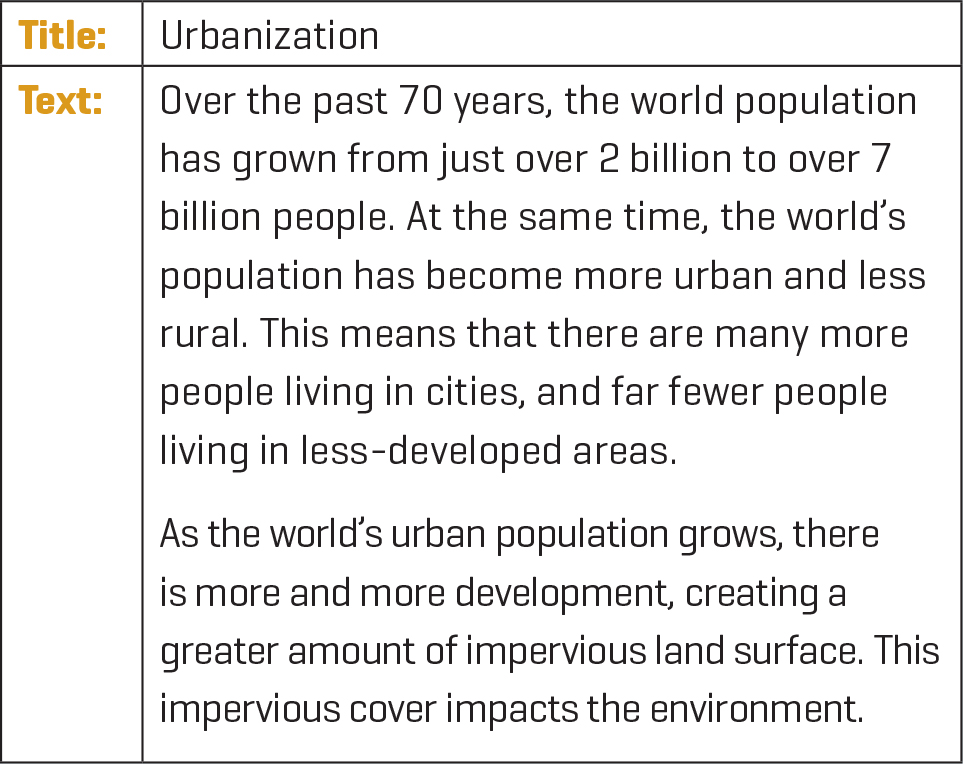
I have students type their infographic captions before working in the software so that I can provide feedback and ensure that the writing is coherent and that the science is sound before they get lost in design and format. I use a template that students access via Google Classroom to type their captions, and embedded in the template is a sample caption from the model infographic (Figure 4) I created and displayed in our initial gallery walk. Typing the text for the infographic is an important check for understanding before students get too deep into the design phase, and it allows me to identify students who need additional support to summarize their learning. Once students are ready to move into the design phase, they use Visme (www.visme.co) to create their infographics. Of all the infographic design platforms available, I chose Visme because they offered inexpensive short-term licenses that allowed me to create and manage accounts for all my students. I could easily view and then download their infographics as high-resolution images or PDFs. The Visme software is also very student friendly. The website has a large library of preloaded images and icons, good graphing and data visualization tools, and students’ work is saved automatically.
Museum exhibit: The Celebration of Learning
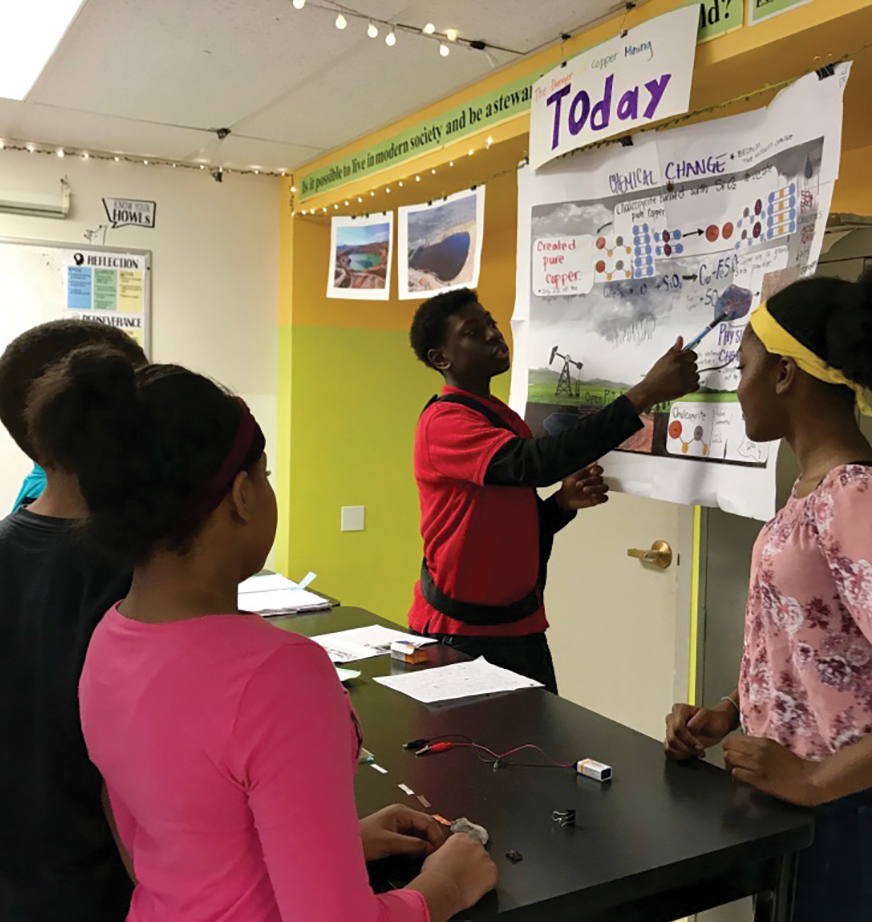
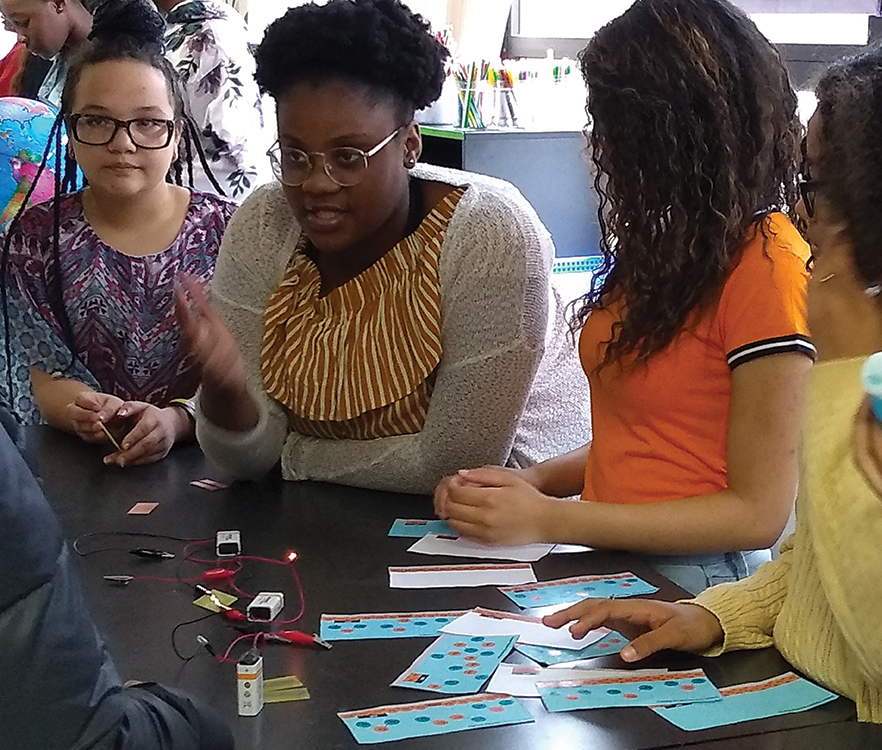
As a school with a focus on interdisciplinary project-based learning, one of the hallmarks of our curriculum is exhibitions of student work, which we call “Celebrations of Learning.” The exhibits (Figure 6) mark the culmination of a major unit and are typically designed as an event where students publish and showcase their final products for a public audience. I often organize my Celebrations of Learning with less of a focus on the final product, and more of a focus on retelling the journey of our learning expedition, from the initial stages through to the final project.
Closing reflections
My goal for our celebration of learning was to give students an opportunity to both showcase and synthesize their learning journey. As I observed students designing, rehearsing, and then facilitating the museum exhibit, I realized that the performance task had the additional benefit of providing students significant additional practice with the content itself. You cannot teach what you do not yet understand, and with the knowledge that we had a large guest list coming to tour our museum, students were deeply invested in making sure they could properly teach the sliver of content they were responsible for at their station.
Guests at our museum were given a program that contained information about the unit and the final project, as well as the following guiding questions to help facilitate their dialogue with students during the exhibit.
- What is your station about?
- What can you teach me about your topic?
- What activities and assignments did you do in class related to this topic?
- What did you most enjoy learning about during this expedition?
- What work are you most proud of?
- How has this unit changed the way you think about electronics?
Students were given advance copies of the program and the guiding questions for guests, and during the exhibit preparation phase, students were asked to rehearse their answers to the questions listed. The final question on the list asks: “How has this unit changed the way you think about electronics?” While students have showcased their physical science learning about the natural and material world, here they are asked to reckon with the idea framed in the Next Generation Science Standards Understandings on the Nature of Science that “science knowledge can describe consequences, but is not responsible for society’s decisions,” and that each of us needs to decide for ourselves if and how we leverage our scientific understanding of our impact on the planet to change our individual actions (NGSS Lead States 2013, Appendix H, p. 6).
Environmental Science Teaching Strategies Middle School