![]()
![]()
Synthesizing Geologic Data Into An Argument for Plate Tectonic Theory

Plate tectonics is considered a “unifying theory” in the field of geology because it synthesizes the work and theories of most other areas of geology (Oreskes and LeGrand 2003). The generation of mountains, deep-sea trenches, volcanic chains, island arcs, and rift valleys can be explained by plate motions. Plate tectonic theory even unites the ideas of sea-floor spreading, subduction, and mantle convection. This article describes a classroom activity that allows students to discover plate interactions as the connection among seemingly different features and processes in geology.
Engage
To introduce the activity, students may be shown images of Mesosaurus, Glossopteris, volcanoes, coal, and earthquake destruction. In the eyes of students, Mesosaurus fossils look similar to the bones of an alligator or crocodile. These fossils often appear in science textbooks to introduce Wegener’s hypothesis of continental drift. Glossopteris is a prehistoric plant that had once required a tropical environment to grow. What makes these plants striking to students is that their fossils appear in places that are no longer tropical, many of which are in Antarctica. To engage students, they are asked what all the images have in common. Students often make connections between volcanoes and earthquakes, recognizing that they are both natural hazards and may occur in similar areas. Inevitably, other students will discuss commonalities between Glossopteris and Mesosaurus, as both are fossilized and represent life long ago, but it is unlikely that they will be able to find a commonality among all five images. Students are reminded that although all geologists study the Earth, there are different specializations within the discipline. Students are expected to follow the example of real geologists as they are challenged to become experts on specific subjects within the field of geology.
Explore
Students are separated into nine small groups or pairs to research topics relating to plate tectonic theory. The topics include Mesosaurus, Glossopteris, and Cynognathus fossils, in addition to mountains, trenches, volcanoes, earthquake epicenters, mantle plumes, and the mid-ocean ridge system. Each group is provided a short list of questions to answer about their topics, but they are also encouraged to add additional relevant information about their topics as they will be sharing their “expertise” with the rest of the class. The questions chosen to prompt each group should assist students to develop an understanding of the topics without leading them directly to plate tectonic theory. The goal is to allow students to discover the connection on their own rather than reading it directly from a book or website. The questions, therefore, are more descriptive in nature rather than requiring explanations for how each geologic feature develops (see Figure 1). Students are reminded to rely on information from sites ending in .gov, .org, and .edu when completing online research.
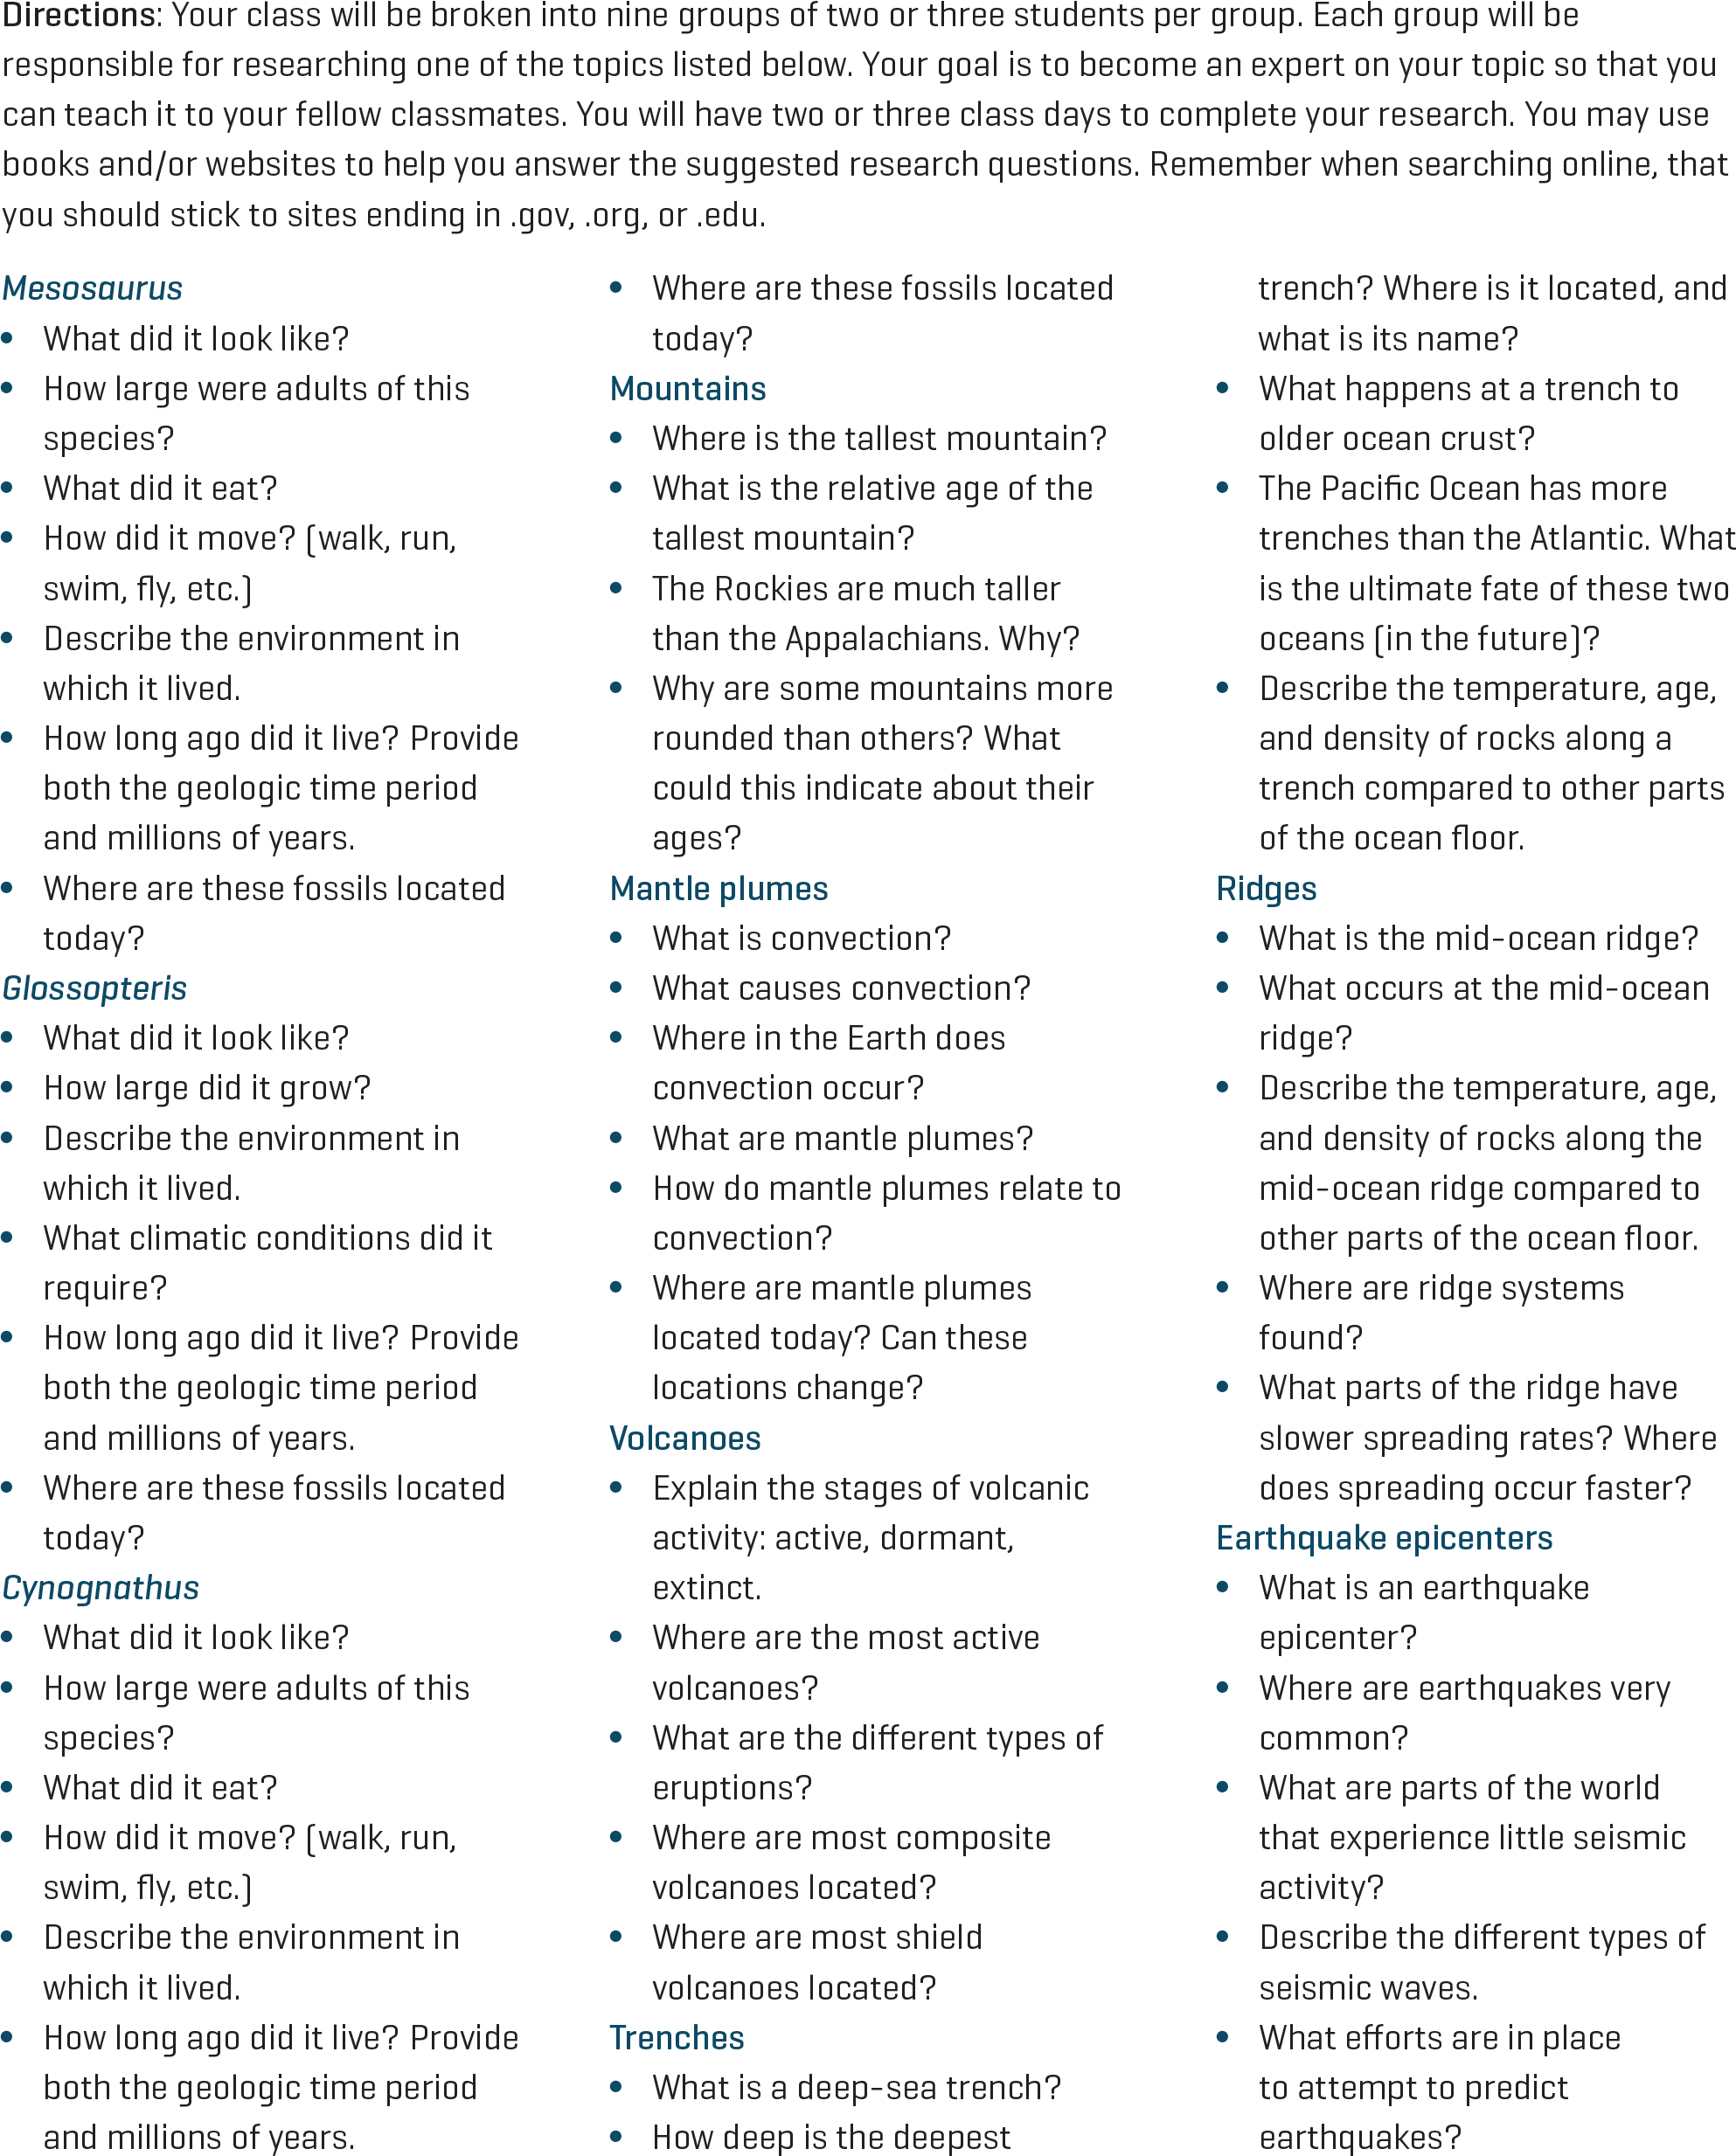
Some of the topics and accompanying questions will prove more difficult for students than other topics. Teachers may differentiate by assigning specific topics to students based on ability level. Mantle plumes tend to be the most abstract, and therefore the most difficult topic for students. I reserve this topic for a high-performing group, along with the mid-ocean ridge and trench systems for other hard-working groups. The fossils are usually easier for students, and many students report liking these topics the best.
A key component of this activity is determining the locations of the individual features so that a pattern may become evident to students. Once each team has completed their list of research questions, their final task will be to determine where their fossils or geologic features may be found. I have asked students to locate these features on their own, but it is a very time-consuming process. Instead, I have found it is easier to provide laminated, color copies of world maps that include the locations of each feature to the respective groups. You will be able to save these and use them year after year. Maps may be found through resources such as , the National Park Service (NPS), and the United States Geological Survey (USGS) websites (see Resources).
Explain
After students have had an adequate amount of time to research their assigned topics (which may take about two or three 45-minute class periods), they will take turns informally presenting their findings to the rest of the class. Students are encouraged to produce visual aids, such as drawings on posters, to assist in their presentations. As soon as each group finishes their research, which may vary based on the ability levels of the students in each group, they should immediately begin working on these visual aids to help in their presentations. This will allow the remaining groups to finish their research while keeping everyone engaged in a task relating to the same project.
As a part of each presentation, students show the class where their feature is found on a world map. In classes well-equipped with technology, students could plot their points on a collaborative Google Map created by the teacher. Each group can contribute their points to separate layers of the Google Map that could later be overlain to show the collective pattern. One issue to avoid using this method is for too many students to be logged in under the same name at any given time. If students are allowed to log in under their own names, this method works very well, but when I have tried it using only a class-specific login, not all of the students’ work would save.
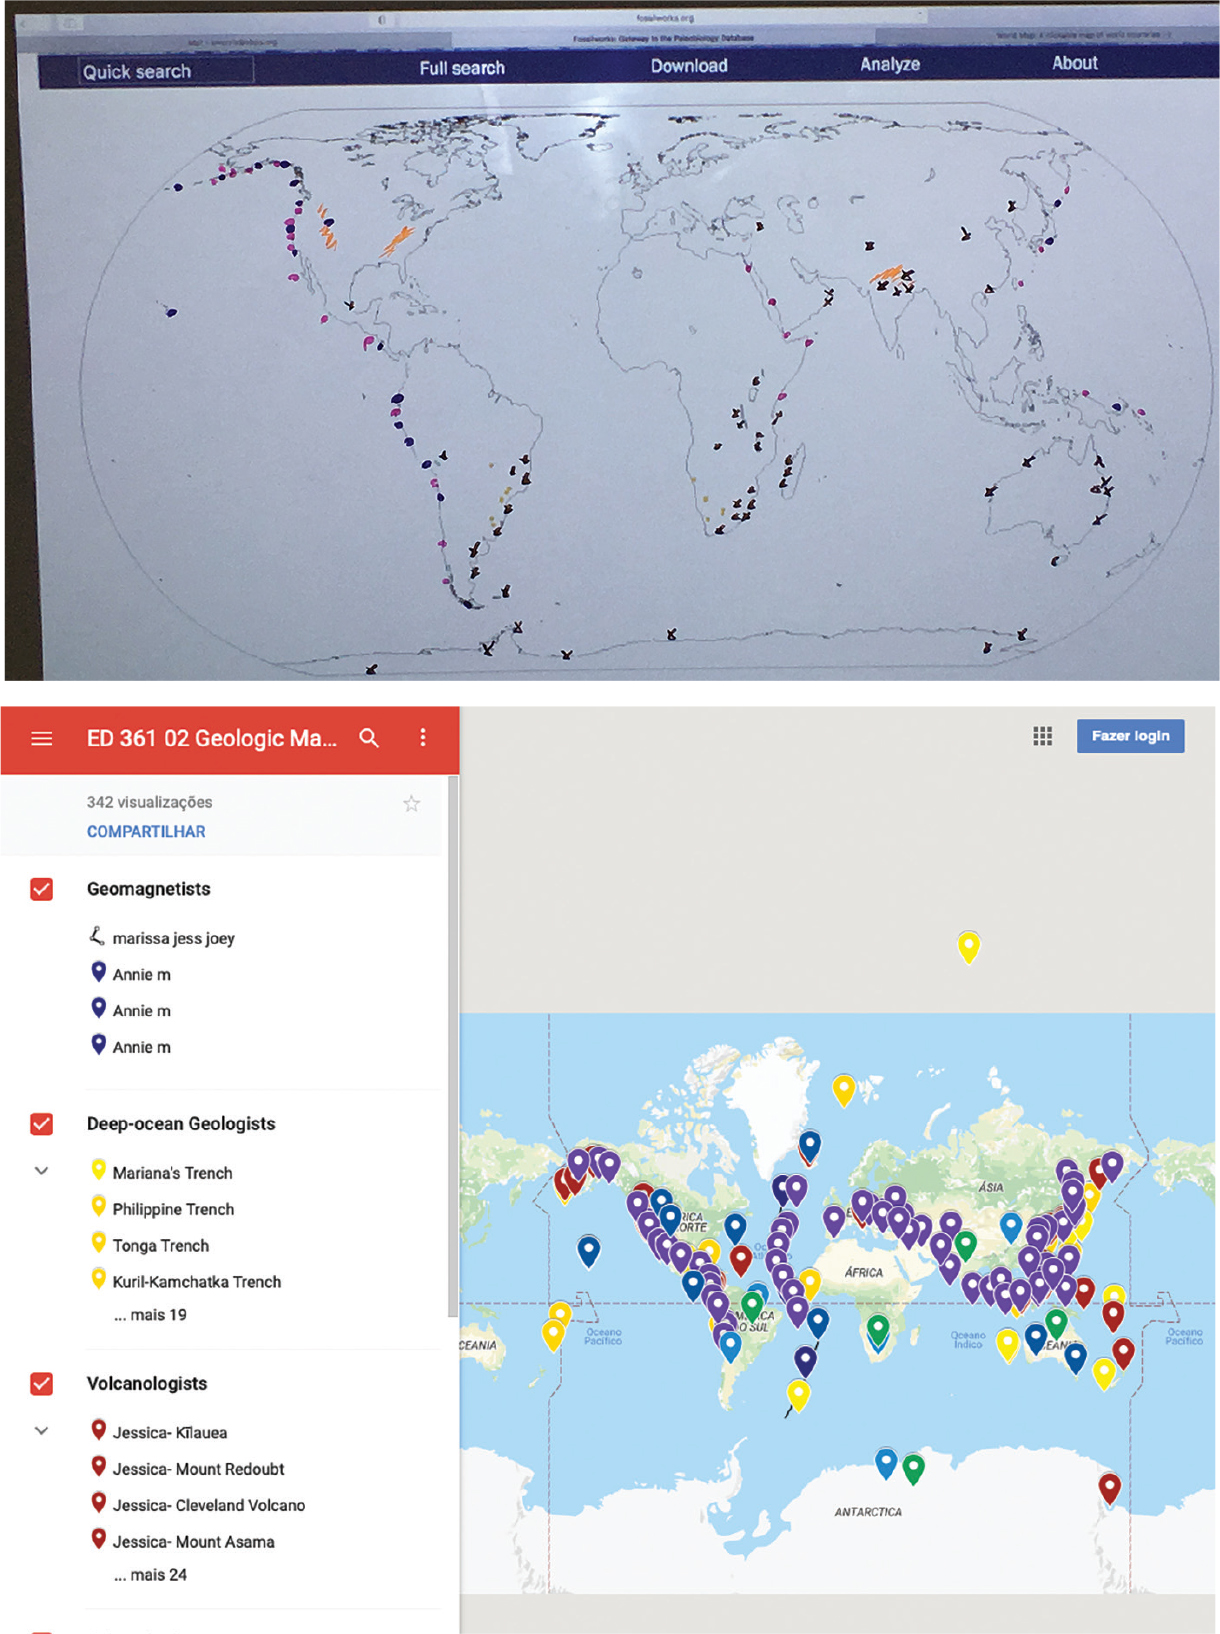
For teachers with access to technology, you can access a collaborative map by using the My Maps feature of Google Maps. When you create a new map on this screen, give it a name that students can use to identify. I usually title each map with the course name and a period number, setting up separate maps for each of the class periods I teach. The teacher should then click the “Share” link and set the sharing preferences to allow access to anyone with a link to the map. E-mail the link to each student in the class. In the preferences, also choose to allow anyone with the link to “Edit” rather than “View” the map. Once each student receives the e-mail, prompt them to follow the link to the map. Each group is assigned a color to use when plotting their data points. Students locate areas on the map where their geologic features are present. They can zoom in to be specific in their placement of data markers. Have students select the “Add Marker” icon to drag and drop their data points. If they drop it in the wrong location, they can drag it to the correct location. Once it is placed, students give it a name according to their geologic feature such as “Volcano 1” or “Mesosaurus Fossil 3.” Students can add a comment with their name so the teacher can track how much work is being performed by each student. Once they click the “Save” button, they can also select the paint can icon to change the color so their markers follow the key. An option for teachers using the interactive Google Map is to create a separate layer for each group. When teaching with this method, I have found it helpful that students are only able to view their group’s placemarkers by selecting their own layer and unselecting the other layers. At the end of the activity, the teacher can show all of the layers at once by checking all of the boxes.
For classrooms with limited technology, the teacher could instead project a world map onto a whiteboard. Student groups are assigned different colored markers and can plot their points onto the map for their classmates to see. There are many points associated with each topic. I have found it is best to have one member of the group present answers to the first two research questions while the other members of the group work on plotting points on the whiteboard. Students can then trade off until all members of the group have had an opportunity to present some of their answers to the class and to plot some of the data points. With nine groups needing to present and plot, the mapping portion of the activity will most likely take two class periods. To save student work, I always take a picture of the partially completed map after the first day. When students come in the next day, I project the photo and allow the remaining groups to plot their points directly on it. Figure 2 shows an example of a map that was started. I take a picture of the completed map for each class period I teach and for future use.
For classes lacking the appropriate prior knowledge, this activity can be amended to accommodate for additional structured lessons. Keep the same introductory activity and exploratory research. If necessary, replace the research component with your own lessons on each of the topics. After spending a few days on each topic, create the corresponding layer of your map together as an entire class so that new points are added every few days. By the end of your unit, your map will be complete and ready for examination and discussion.
Color key for mapping exercises
- Mesosaurus: Light blue
- Glossopteris: Green
- Cynognathus: Pink
- Mountains: Brown
- Mantle plumes: Purple
- Volcanoes: Red
- Trenches: Dark blue
- Mid-ocean ridge: Black
- Earthquake epicenters: Orange
Elaborate
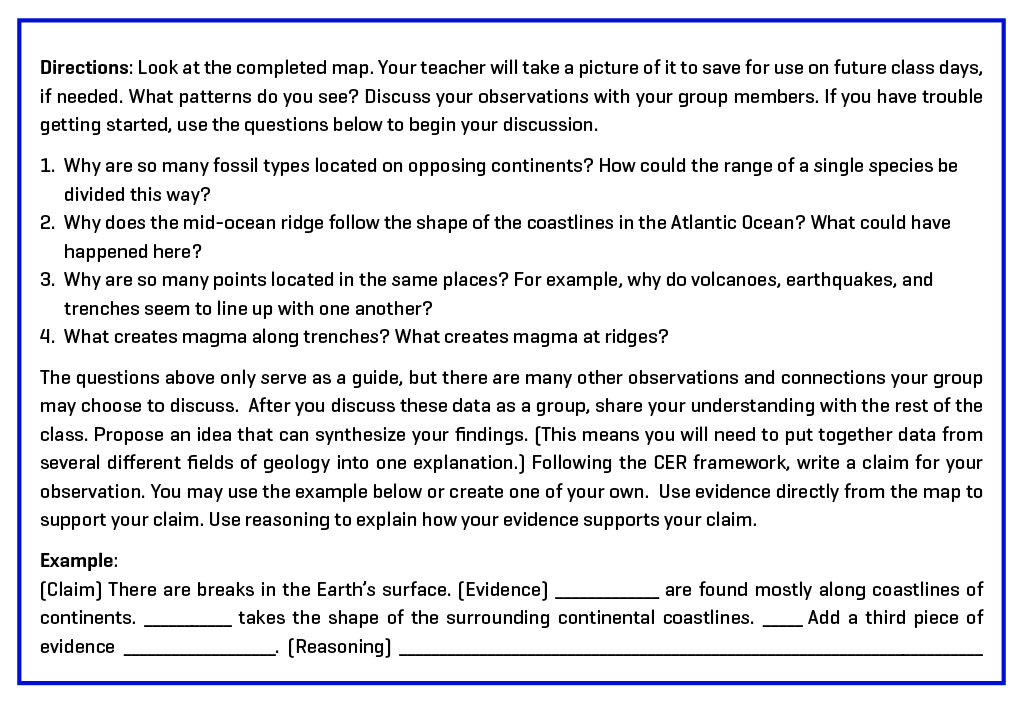
Once the presentations have all been completed, the class will be able to look at the completed map. The map will have the locations of fossils, mountain chains, mantle plumes, volcanoes, deep-sea trenches, mid-ocean ridges, and earthquake epicenters plotted for the class to analyze. Students should see a distinguishable trend outlining the plate boundaries, indicating that these geologic features are not isolated from one another as students, and even scientists, had once thought. Boundaries between plates actually follow a predictable pattern and are more connected than people first realized. Students should work in their groups to make sense of the patterns they see. Prompting questions for student discussion are included in the student worksheet if assistance is needed in generating class discourse.
Ideally, students will recognize that distributions of fossils should not be separated by a large ocean. Students tend to discuss the inability of the animals to swim or fly across the ocean and require another explanation for the split in each species distribution. Students also easily recognize that the shape of the mid-Atlantic ridge runs parallel to coastlines on either side of the ocean. This is the point at which they begin to suggest the continents may once have been joined. It can be pointed out that Alfred Wegener used similar evidence in his continental drift hypothesis, which was overlooked because he could not provide an explanation for the mechanism of plate movement.
As the discussion continues, the focus should be on finding the mechanism responsible for the movement of the plates. The locations of mid-ocean ridges and deep-sea trenches will become important in the conversation as sea-floor spreading and subduction play a large role in the process. Students will also begin to notice that mantle plumes often correspond with the breaking of the crust, allowing for movement to occur. To extend the discussion further, students may be asked how magma is generated along ridge systems and subduction zones, leading to generation of volcanoes and islands in these areas.
In my experience, prompting for the discussion is going to be required, but the extent to which it is needed will vary based on students in the class. Honors students, for example, may jump to the conclusion before working through the data the way I intend. I tell them that I can’t believe their conclusion without the proper evidence. They immediately go back and keep searching, eager to prove themselves right. My in-class resource classes are the opposite in terms of willingness to draw conclusions or to participate altogether. With these students, I have them arrive at conclusions in their small groups first. They must agree and record an answer. I walk around conferencing with the small groups, asking prompting questions as needed. Students are more comfortable and willing to answer when I am with their individual groups. After doing this, I am able to begin the classwide discussion because they have written answers in front of them for support and our individual conversations have given them courage. Other classes may fall anywhere between these two extremes and should be handled in a way that is best for the students involved.
Evaluate
The Next Generation Science Standards focus on the scientific skills students are building. In this activity, students are constructing their own knowledge as they analyze and interpret trends in the data revealed through the collaborative class map. Students can practice constructing arguments for plate tectonic theory using the evidence from the map as support for their conclusions. At this point, students won’t necessarily know the term plate tectonic theory, so it is likely that their arguments will begin by relating the data to describe that there “are breaks in Earth’s crust” instead. Once students have analyzed the data, made their claims, and used evidence and reasoning to support their claims, you will be able to describe plate tectonic theory in greater detail, relating this activity back to the real work of scientists. Geologists may work in very specific fields, but they share their research with colleagues within and across the disciplines to describe natural phenomena.
Depending on the ability level of students, teachers may assist students in organizing their thoughts into coherent written arguments. The activity lends itself well to using the Claim-Evidence-Reasoning (CER) framework for student responses. Based on the class discussion, students should make a claim that Earth’s surface is broken into moving pieces. Later, you will supply the information that these pieces are called plates. Students should use data from their class map to provide evidence supporting this claim. Finally, students should use reasoning to explain how their evidence supports their claim. I keep an anchor chart above the chalkboard to supply students with a constant reminder of what belongs in each part of a CER response. I also differentiate the writing activity by providing sentence stems to struggling writers and ELL students as shown below.
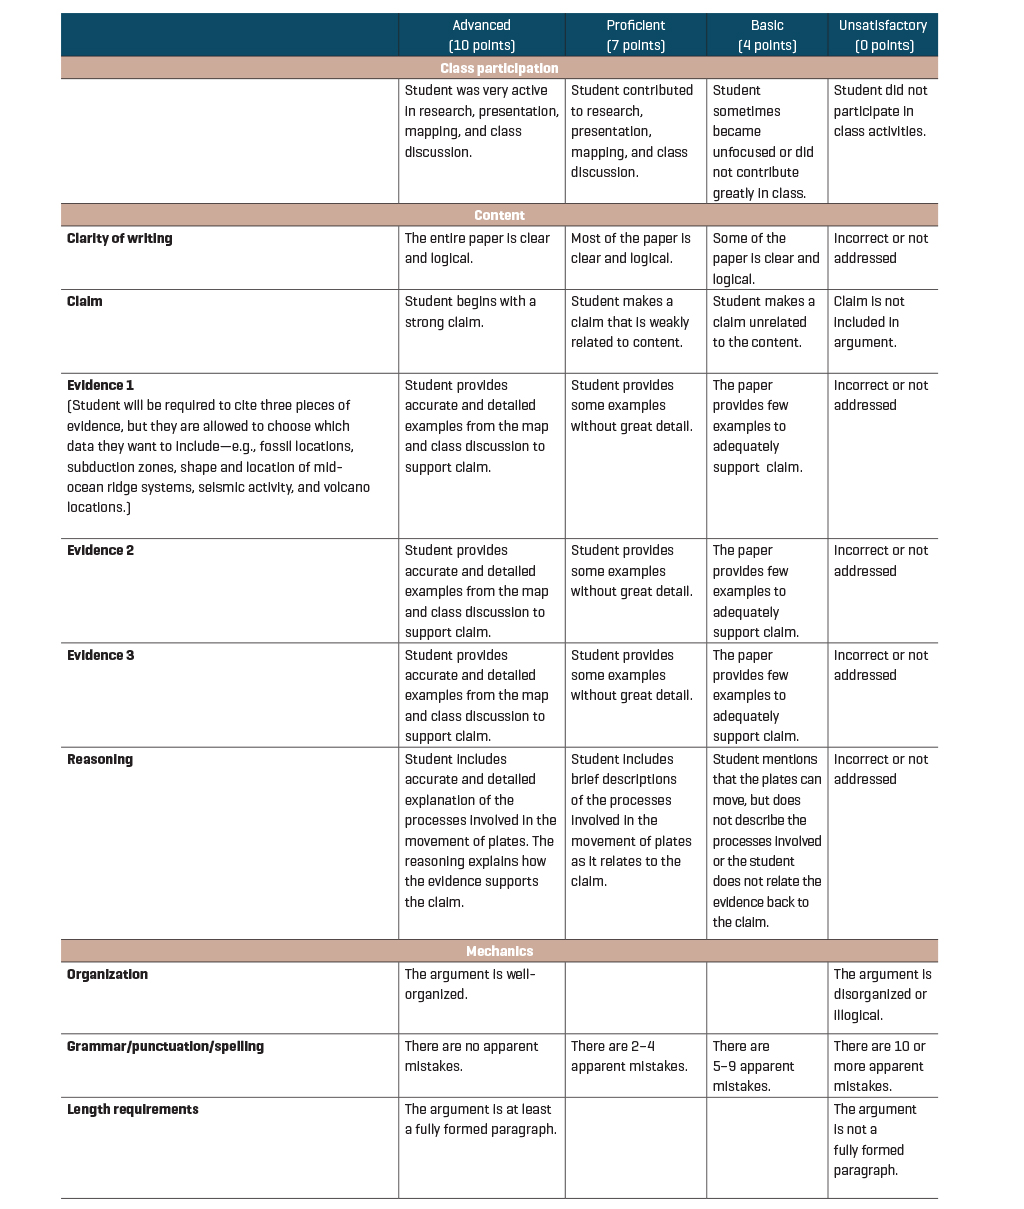
Students’ written responses act as the summative assessment for this activity. Though the research, presentation, mapping, and discussion activities for this project are used for formative assessment, students still earn points toward their grade for participation in these phases. The main part of their grade, however, comes from the proficiency with which they synthesize the data into an explanation for plate motions. See Figure 3 for a rubric.
This activity encourages cooperative learning and critical thinking while allowing students to build technological skills and scientific literacy. It allows for easy differentiation in several ways, uses actual data, and directly addresses one of the NGSS standards. It is definitely an activity worth trying in your own classroom.
Earth & Space Science Physical Science Middle School