![]()
![]()
Middle School High School | Daily Do
Why Does Population Size Change?

Biology Crosscutting Concepts Disciplinary Core Ideas Is Lesson Plan Life Science Mathematics NGSS Phenomena Science and Engineering Practices Three-Dimensional Learning Middle School High School Grades 6-8
Welcome to NSTA's Daily Do!
Teachers and families across the country are facing a new reality of providing opportunities for students to do science through distance and home learning. The Daily Do is one of the ways NSTA is supporting teachers and families with this endeavor. Each weekday, NSTA will share a sensemaking task teachers and families can use to engage their students in authentic, relevant science learning. We encourage families to make time for family science learning (science is a social process!) and are dedicated to helping students and their families find balance between learning science and the day-to-day responsibilities they have to stay healthy and safe.
Interested in learning about other ways NSTA is supporting teachers and families? Visit the NSTA homepage.
What Is Sensemaking?
Sensemaking is actively trying to figure out how the world works (science) or how to design solutions to problems (engineering). Students do science and engineering through the science and engineering practices. Engaging in these practices necessitates that students be part of a learning community to be able to share ideas, evaluate competing ideas, give and receive critique, and reach consensus. Whether this community of learners is made up of classmates or family members, students and adults build and refine science and engineering knowledge together.
Introduction
In today's task, Why does population size change?, students engage in science and engineering practices and use the lens of cause and effect (crosscutting concept) to figure out there is a maximum number of buffalo an area can support based on the living and nonliving components of the ecosystem. This task has been modified from its original design to be used by high school students, families, and teachers in distance and home learning. While students could complete this task independently, we encourage students to work virtually with peers or in the home with family members.
Before you begin the task, you may want to access the accompanying Why does population size change? Google slide presentation.
Presentation of Phenomena (What am I exploring today?)
Guidance. Students experience the phenomenon of a buffalo population reaching an equilibrium size in a particular environment through the use of a simulation. The goal is to get students to identify patterns in data to develop a cause-and-effect relationship between population size and available resources. Students will develop predictions using patterns they noticed from the simulation to identify cause-and-effect relationships.
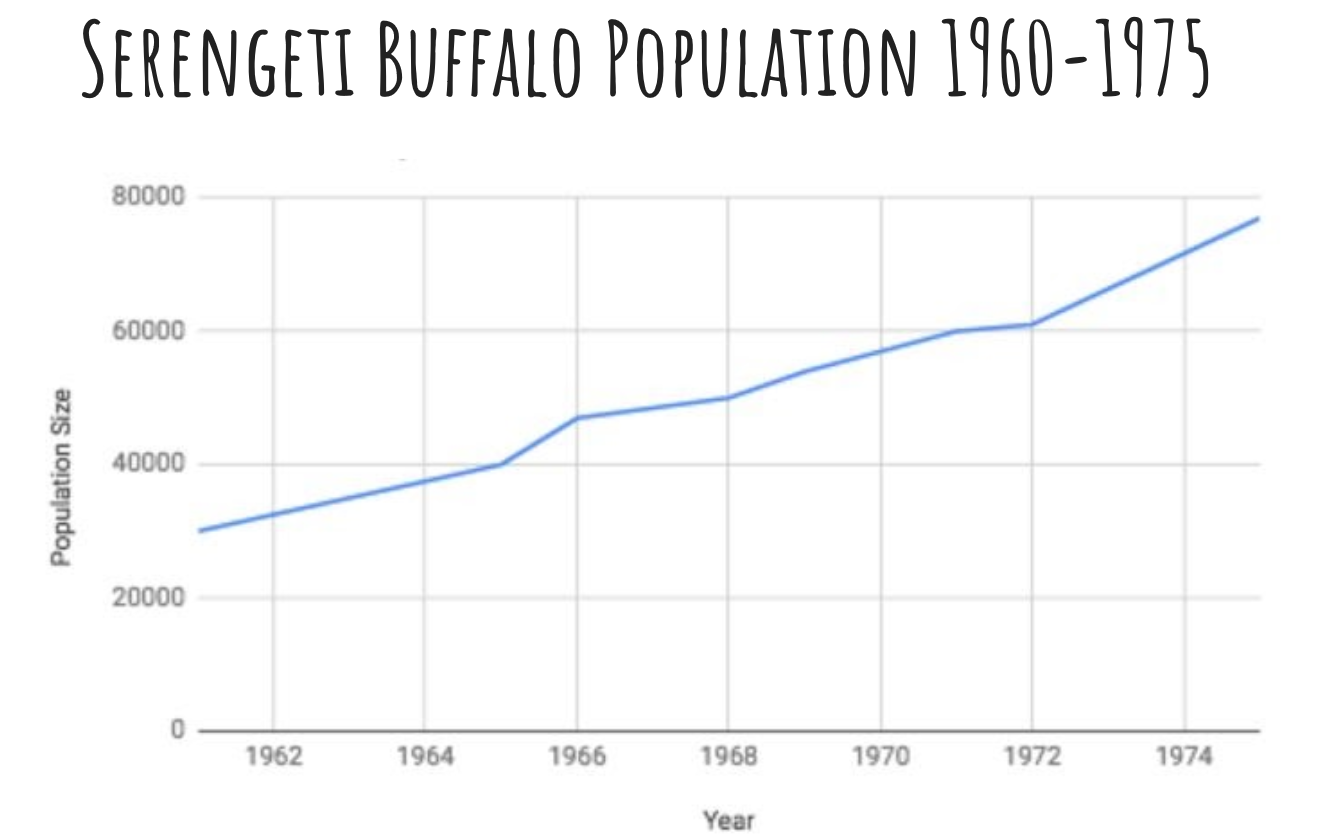
Presenting the Phenomenon. Ask students to examine the buffalo population graph (slide 2) and to record any possible reasons to explain the population increase on the Student Task Sheet or piece of paper. Students' possible reasons may include increased amounts of food, decreased numbers of predators, or less competition for resources.
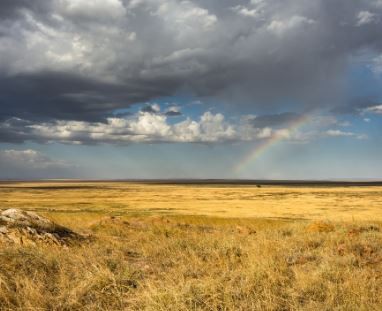
Next, show students the two images of buffalo herds grazing in the Serengeti (slides 3 and 4). Ask them to record what they notice and wonder on a sheet of paper. Students will revisit these questions at the end of the lesson during the Building Consensus discussion.
Suggested prompts
- What did you notice in the images?
- What are you wondering?
- How could your observations help explain the population growth on the graph?
Examples of student responses
- In one picture, the grass is all brown, and in the other, there is some green grass.
- There are a lot of buffalo in the first image, like mostly off in the distance.
- I notice some trees and shrubs/bushes in the second picture; the first is all grass.
- I notice that in the second picture, there are babies, but there aren't any in the first.
- Is there enough food?
- Do buffalo like dry grass better than green grass?
- Are these in different locations?
- Are these different times of the year?
Investigative Questions (How can we use a simulation to investigate our questions?)
Guidance. Students use a simulation to investigate the effects of different factors on buffalo population size to figure out a particular environment has a maximum number of individuals within a population it can support. It is important to have students define which factors they want to investigate in the simulation, such as changes in amount of food, competition, space, and climate. Students should focus on one factor at a time to determine its effect on the buffalo population size.
Initial Investigation. Show students the tutorial video (see also slide 5), then have students run the Serengeti Consumers simulation to identify patterns in the buffalo population over time using the following parameters (default settings) (slide 6):
- Initial buffalo population 10
- 100% grass coverage (central region)
- Fences ON
- Seasonal rains OFF
- Wildebeests to add at 0
- Vaccine ON
- % buffalo to infect at 25
- Wildebeest migrate OFF
- Run for 2,500–3,000 units of time
When students are ready to run the simulation, they need to click the Setup/Reset button, then Go/Pause to start the simulation.
Tell students to record the final population and share with a partner or group. Ask them to record everyone's data in Table 1 on the Student Task Sheet. (If students are completing this task asynchronously, have them run the simulation a total of three times using these parameters). Once students have gathered all their data, ask them to analyze the data and identify any patterns they see.
Students should notice a pattern in the final population sizes from simulation to simulation. Use this pattern to introduce the science idea of carrying capacity by saying, "Scientists have a term for the maximum number of organisms of a species that an ecosystem can contain. They call this carrying capacity." (slide 7) Have students record the carrying capacity of this ecosystem based on their data. The carrying capacity should be around 40 buffalo using the above parameters.
Further Investigations. Instruct students to investigate at least two different changes in the ecosystem (slide 8). They may choose to look at changes in the following factors:
- Initial buffalo population
- Grass coverage
- Space
- Precipitation
- Competition
To make changes to the simulation, students need to first click the Set Up/Reset button.
Before students press the Go/Pause button, ask them to predict what will happen to the buffalo population based on the changes they made to the ecosystem. Remind students to record the parameters for each investigation and the final buffalo population size in Tables 2 and 3 on the Student Task Sheet.
My Observations (What can our observations tell us about cause-and-effect relationships in ecosystems?)
Guidance. Students will make connections using patterns in data to develop a cause-and-effect relationship between the buffalo population and changes in the ecosystem.
Show slide 9 and give students time to share their data from the simulations they ran with one another, then ask them to respond to the following prompts, also found in the Student Task Sheet.
Suggested Prompts
- Based on your data from the simulations, what cause-and-effect relationships do you see in the buffalo population?
- Which cause best explains the Serengeti Buffalo Population 1960–1975 graph?
Common Responses
- As the initial number of buffalo was increased, the number of buffalo decreased.
- As the amount of grass decreased, the number of buffalo decreased.
- As the space increased, the number of buffalo increased.
- Seasonal rains allowed the number of buffalo to increase because there was more grass.
- Wildebeest don't affect the buffalo population.
- Increased amounts of food and precipitation best explain the increase in the population, but not as much as what we see in the graph.
Building Consensus
Take a moment to look back at what we have figured out from the simulation using the prompt on slide 10 to guide the discussion. Give students some time to respond to the prompt before asking them what they have written.
Prompt. What conclusions can be made about how changes in an environment can impact the carrying capacity of specific organisms?
Common Responses
- Changes in the environment can have both positive and negative effects on the carrying capacity of a population.
- Decreasing food availability and increasing competition for resources negatively affects carrying capacity.
- Increasing space and precipitation increases the amount of food available, which positively affects carrying capacity.
Guidance. It is important to allow students to document what they have figured out on their own in their own words. During the discussion, the students should do most of the talking, and the adult is there to listen and prompt the student. Some suggested prompts are these:
- How does your data support your conclusion?
- Does anyone agree or disagree with what ... is saying? Why or why not?
- Can you rephrase what ... just said? or What I think you're saying is ..., is that correct?
This lesson begins to build understanding of the complex relationships that govern ecosystem dynamics. If you are interested in the storyline this task was excerpted from, see the Acknowledgements section below.
Note: If you want to learn more about how to get students talking, visit STEM Teaching Tool 48, How can teachers guide classroom conversations to support students' learning?
Home Connections
While the Serengeti isn't a place most students have personally experienced, they can connect the rules that govern this large ecosystem to the ecosystems around them. Families can expand on the ideas in this learning task in many ways at home, including these:
- Visiting parks or other outdoor areas
- Watching videos of other ecosystems
Another resource you could explore is the episode The Serengeti Rules from the PBS series Nature.
NSTA Collection of Resources for Today's Daily Do
NSTA has created a Why does population size change? collection of resources to support teachers and families using this task. If you're an NSTA member, you can add this collection to your library by clicking ADD TO MY LIBRARY, located near the top of the page (at right in the blue box).
Check Out Previous Daily Dos From NSTA
The NSTA Daily Do is an open educational resource (OER) and can be used by educators and families providing students distance and home science learning. Access the entire collection of NSTA Daily Dos.
Acknowledgement
This Daily Do is inspired by and uses materials from the How Do Small Changes Make Big Impacts on Ecosystems? storyline created by Next Gen Storylines and inquiryHub. Next Gen Storylines is an open-source resource that can be used by parents and teachers to implement student-driven learning. inquiryHub is a research-based curricula supporting Next Generation Science.